
Vista detallada de la línea de tiempo del agente
Los siguientes permisos:
- ui > supervisorAgentDetails > view
- directorio > usuario > vista
- analytics > userDetail > view
Para ver la parte de interacciones de la línea de tiempo:
- analytics > conversationAggregate > view
- analytics > conversationDetail > view
Para seleccionar las métricas, necesita una de las siguientes opciones:
- analytics > userAggregate > view
- analytics > conversationAggregate > view
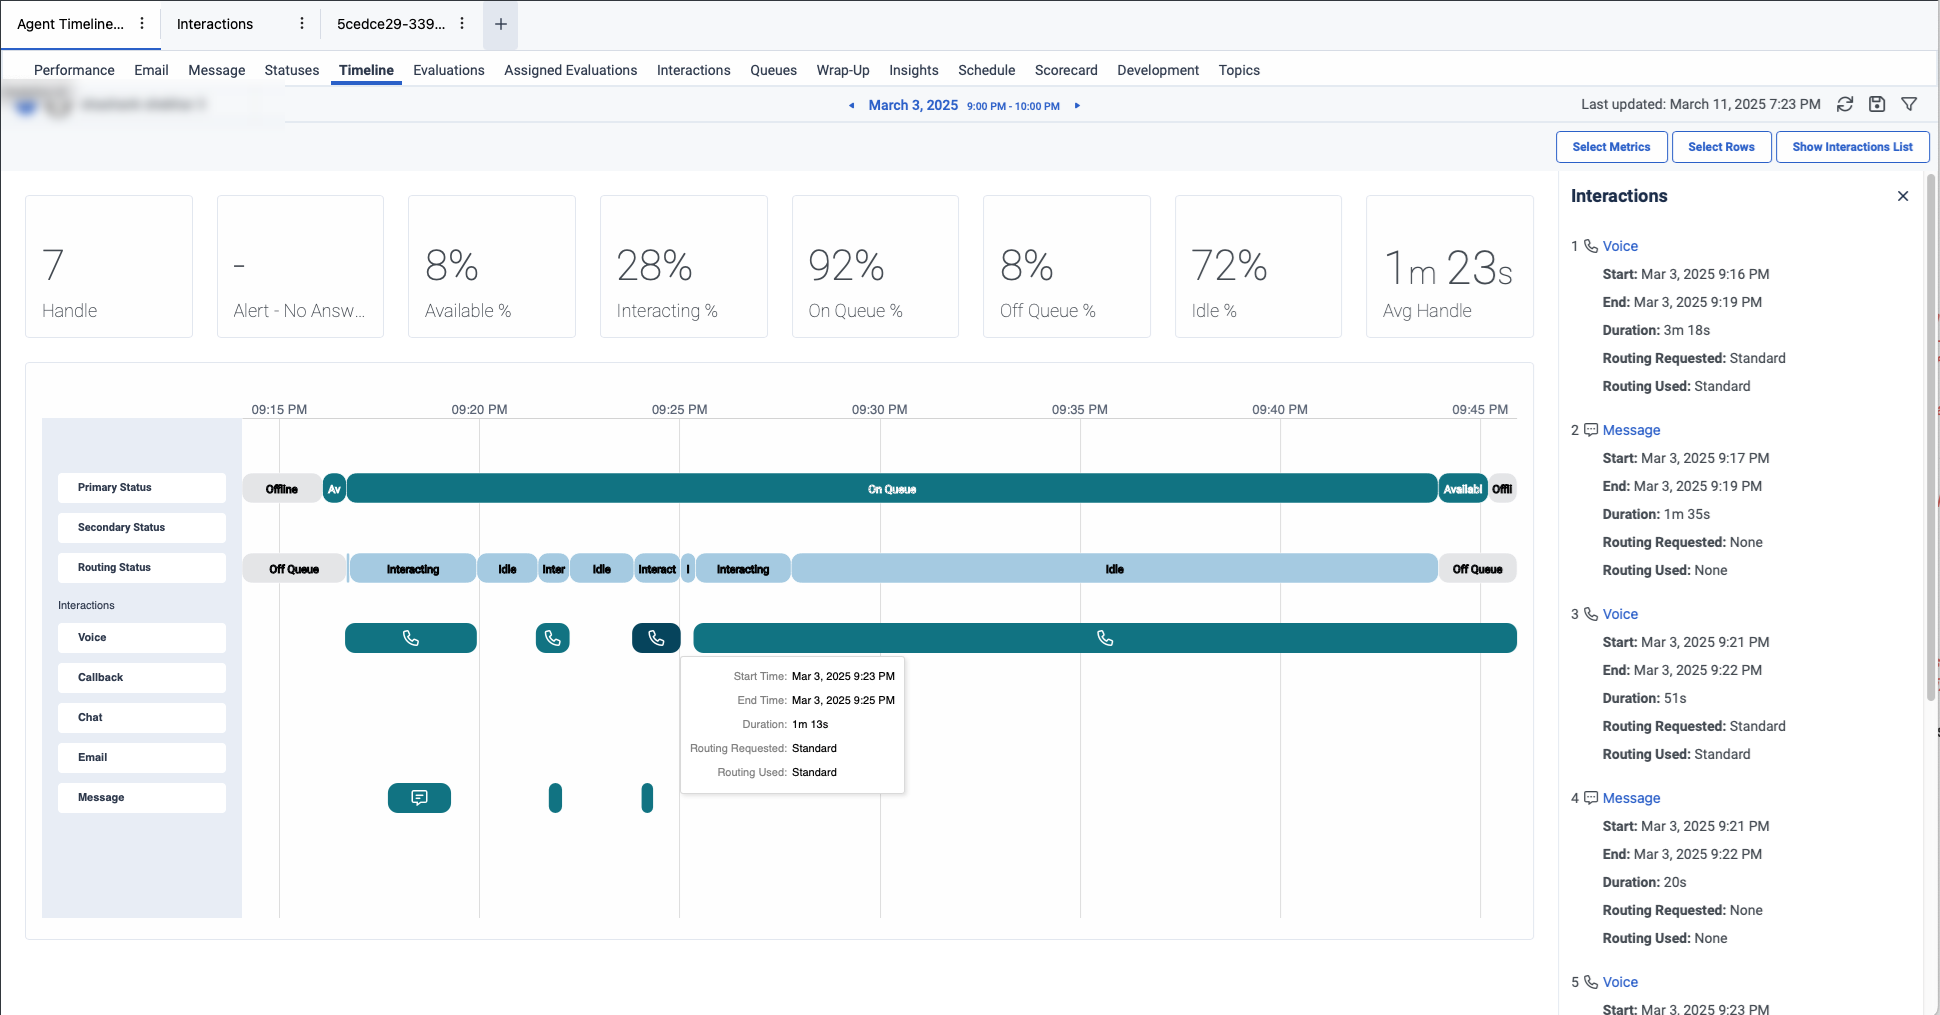
La vista Detalle de la línea de tiempo del agente proporciona una representación visual detallada de las conversaciones gestionadas por los agentes. Esta vista permite a los supervisores obtener una mayor visibilidad de las actividades de los agentes. Los supervisores pueden ver cómo la secuencia de conversaciones de voz atendidas por los agentes se entrelaza con la superposición de múltiples interacciones digitales simultáneas.
Por defecto, esta vista proporciona detalles sobre el estado primario, el estado secundario, el estado de enrutamiento y varias interacciones como voz, devolución de llamada, chat, correo electrónico y mensajes.
Para ver los detalles de la línea de tiempo del agente:
- Haga clic en Rendimiento > Espacio de trabajo > Centro de contacto > Rendimiento del agente.
- Haga clic en Menú > Análisis > Espacio de trabajo de análisis.
- En la sección Default, busque Agent Performance y haga clic en el nombre de la vista para abrirla.
- En la vista Resumen del rendimiento de los agentes de , haga clic en el nombre de un agente. Aparece la vista Detalle del rendimiento del agente.
- Haga clic en la pestaña Timeline. Aparece la vista Detalle de la Línea de Tiempo del Agente.
 Para ver los datos más actuales, pulse Actualizar .
Para guardar la vista, haga clic en Guardar vista .
Puedes ampliar o reducir el intervalo de tiempo en la línea de tiempo. Por ejemplo, puede ver que en el selector de fechas está seleccionado el intervalo de 9 a 10 de la noche del 3 de marzo. Sin embargo, la línea de tiempo se amplía hasta justo antes de las 21:15 y justo después de las 21:45. Si alejas la imagen, puedes ver toda la hora de las 21 a las 22 horas. Si se ha acercado a menos de una hora, puede desplazarse horizontalmente hasta el límite de las 21:00 a la izquierda y hasta el límite de las 22:00 a la derecha.
Para acercar y alejar la imagen en el sistema operativo Windows, puedes mantener pulsada la tecla Control (Ctrl) y desplazarte con el ratón o el trackpad. Para desplazarse horizontalmente en el sistema operativo Windows, puede utilizar un trackpad. Para acercar y alejar la imagen en el sistema Mac OS, puedes mantener pulsada la tecla Comando (CMD) y desplazarte con el ratón o el trackpad. Para desplazarse horizontalmente en el sistema Mac OS, puede mantener pulsada la tecla Mayús y desplazarse con el ratón o el trackpad.
- La línea de tiempo no muestra ningún resultado para el estado primario, secundario o de enrutamiento si el agente ha tenido largos periodos de inactividad.
- Sólo puedes ver los datos de hasta siete días.
- Si el número de interacciones dentro del intervalo de tiempo seleccionado es superior a 200, se muestra un mensaje de advertencia en la parte superior y un enlace a la página de vista Detalles de la interacción del agente.
Personaliza la vista
Para mostrar sólo datos específicos, personalice la vista detallada de la cronología del agente. Por ejemplo, puede elegir ver sólo determinadas métricas o filtrar para ver determinados tipos de interacciones.
Para personalizar las vistas de análisis, utilice el filtro de fechas.

Para filtrar las métricas por fecha o configurar un intervalo de fechas personalizado, utilice los preajustes. Al filtrar las métricas para esta vista, seleccione cualquier intervalo de fechas personalizado de hasta 7 días.
Para usar un ajuste preestablecido para filtrar métricas, complete los siguientes pasos:
- Para mostrar el filtro de fechas, haga clic en la fecha.
- En la lista Preestablecidos, seleccione una opción de fecha preestablecida.
Ajustes preestablecidos de fecha
| Preajustes | Descripción |
|---|---|
| Intervalo actual | Muestra datos para el período de tiempo actual de 30 minutos. |
| Hoy dia | Muestra datos para el período de tiempo que incluye el intervalo actual. |
| El dia de ayer | Muestra datos del día anterior. |
| Esta semana | Muestra datos para un período de tiempo de domingo a sábado. |
| La semana pasada | Muestra datos de la semana anterior, de domingo a sábado. |
| 7 días anteriores | Muestra datos de los siete días anteriores. |
| Intervalo | Muestra datos durante un período de tiempo de 30 minutos. |
| Día | Muestra datos para un solo día de 24 horas. |
| Semana | Muestra datos para un período de tiempo de domingo a sábado. |
- Para usar un rango de fechas personalizado para filtrar métricas, complete los siguientes pasos:
-
- Haga clic en la fecha para mostrar el filtro de fecha.
- Seleccione una fecha de inicio y una fecha de fin en el calendario y haga clic en la flecha de filtrado .
- Para ver los datos de un periodo de tiempo diferente utilizando las mismas fechas predefinidas, haga clic en las flechas situadas a ambos lados de la visualización de la fecha. Por ejemplo, para ver los datos del día anterior, haga clic en el preajuste Day y, a continuación, haga clic en la flecha situada a la izquierda de la fecha.
- Para ver los datos de una zona horaria diferente utilizando las mismas fechas preestablecidas, en el menú desplegable Zona horaria, seleccione la zona horaria deseada. Puede crear y guardar informes con la misma zona horaria seleccionada.
Para filtrar las interacciones por tipo de medio:
- Haga clic en el icono Filtro
 .
. - Seleccione el tipo de soporte.
Las interacciones se filtran en función del tipo de medio elegido.
Para seleccionar las métricas de la fila de resumen:
- Haga clic en Seleccionar métricas.
- Seleccione las categorías de métricas necesarias, como Basada en el recuento, Basada en el porcentaje, y Basada en el tiempo.
- Seleccione la métrica deseada. Para obtener más información sobre las métricas disponibles, consulte la sección de la vista detallada de la línea de tiempo del agente en el artículo Ver columnas disponibles en las vistas de rendimiento por categoría.
Nota: Puede elegir hasta 12 métricas. - Haga clic en Añadir. Se muestran las métricas seleccionadas.
Para ver la lista consolidada de las métricas disponibles en las vistas de rendimiento, consulte Vista consolidada de las columnas disponibles en las vistas de rendimiento.
Para mostrar u ocultar las filas de la línea de tiempo:
- Haga clic en Seleccionar filas. Aparecerá la ventana emergente Seleccionar filas.
- Seleccione las filas necesarias, como Estado primario, Estado secundario, Estado de enrutamiento, y Interacciones.
- Haga clic en Confirme. Las filas seleccionadas se muestran en la parte izquierda.
Para mostrar u ocultar la lista de interacciones, haga clic en Mostrar lista de interacciones.
Todas las interacciones para el intervalo de fechas elegido aparecen en la parte derecha.
Para ver más detalles sobre cualquier interacción, haga clic en la interacción deseada. Accederá a la página de detalles de la interacción.