
Vista de exploración de contenidos
Prerrequisitos
Cualquiera de las siguientes licencias:
- Licencia de Genesys Cloud CX 3 Digital o Genesys Cloud EX
- Licencia Genesys Cloud CX 1 WEM Add-on II, Genesys Cloud CX 2 WEM Add-on I, Genesys Cloud CX 3 o Genesys Cloud CX 4
- Complemento de actualización de análisis de voz y texto
Se requieren los siguientes permisos para acceder a la Búsqueda de Contenidos:
- Enrutamiento > Ajustes de transcripción > Ver
- Análisis de voz y texto > Datos > Ver
Al menos uno de los siguientes permisos:
- Analítica > Detalle de la conversación > Vista
- Grabación > Grabación > Ver
- Grabación > GrabaciónSegmento > Vista
Para buscar temas en :
- Speech and Text Analytics > Tema > Ver permiso
Para volver a conectarse a un correo electrónico cerrado :
- Conversación > Comunicación > reconexión permiso
Para activar la búsqueda de contenido transcrito para una org:
- Búsqueda del contenido de la transcripción habilitado
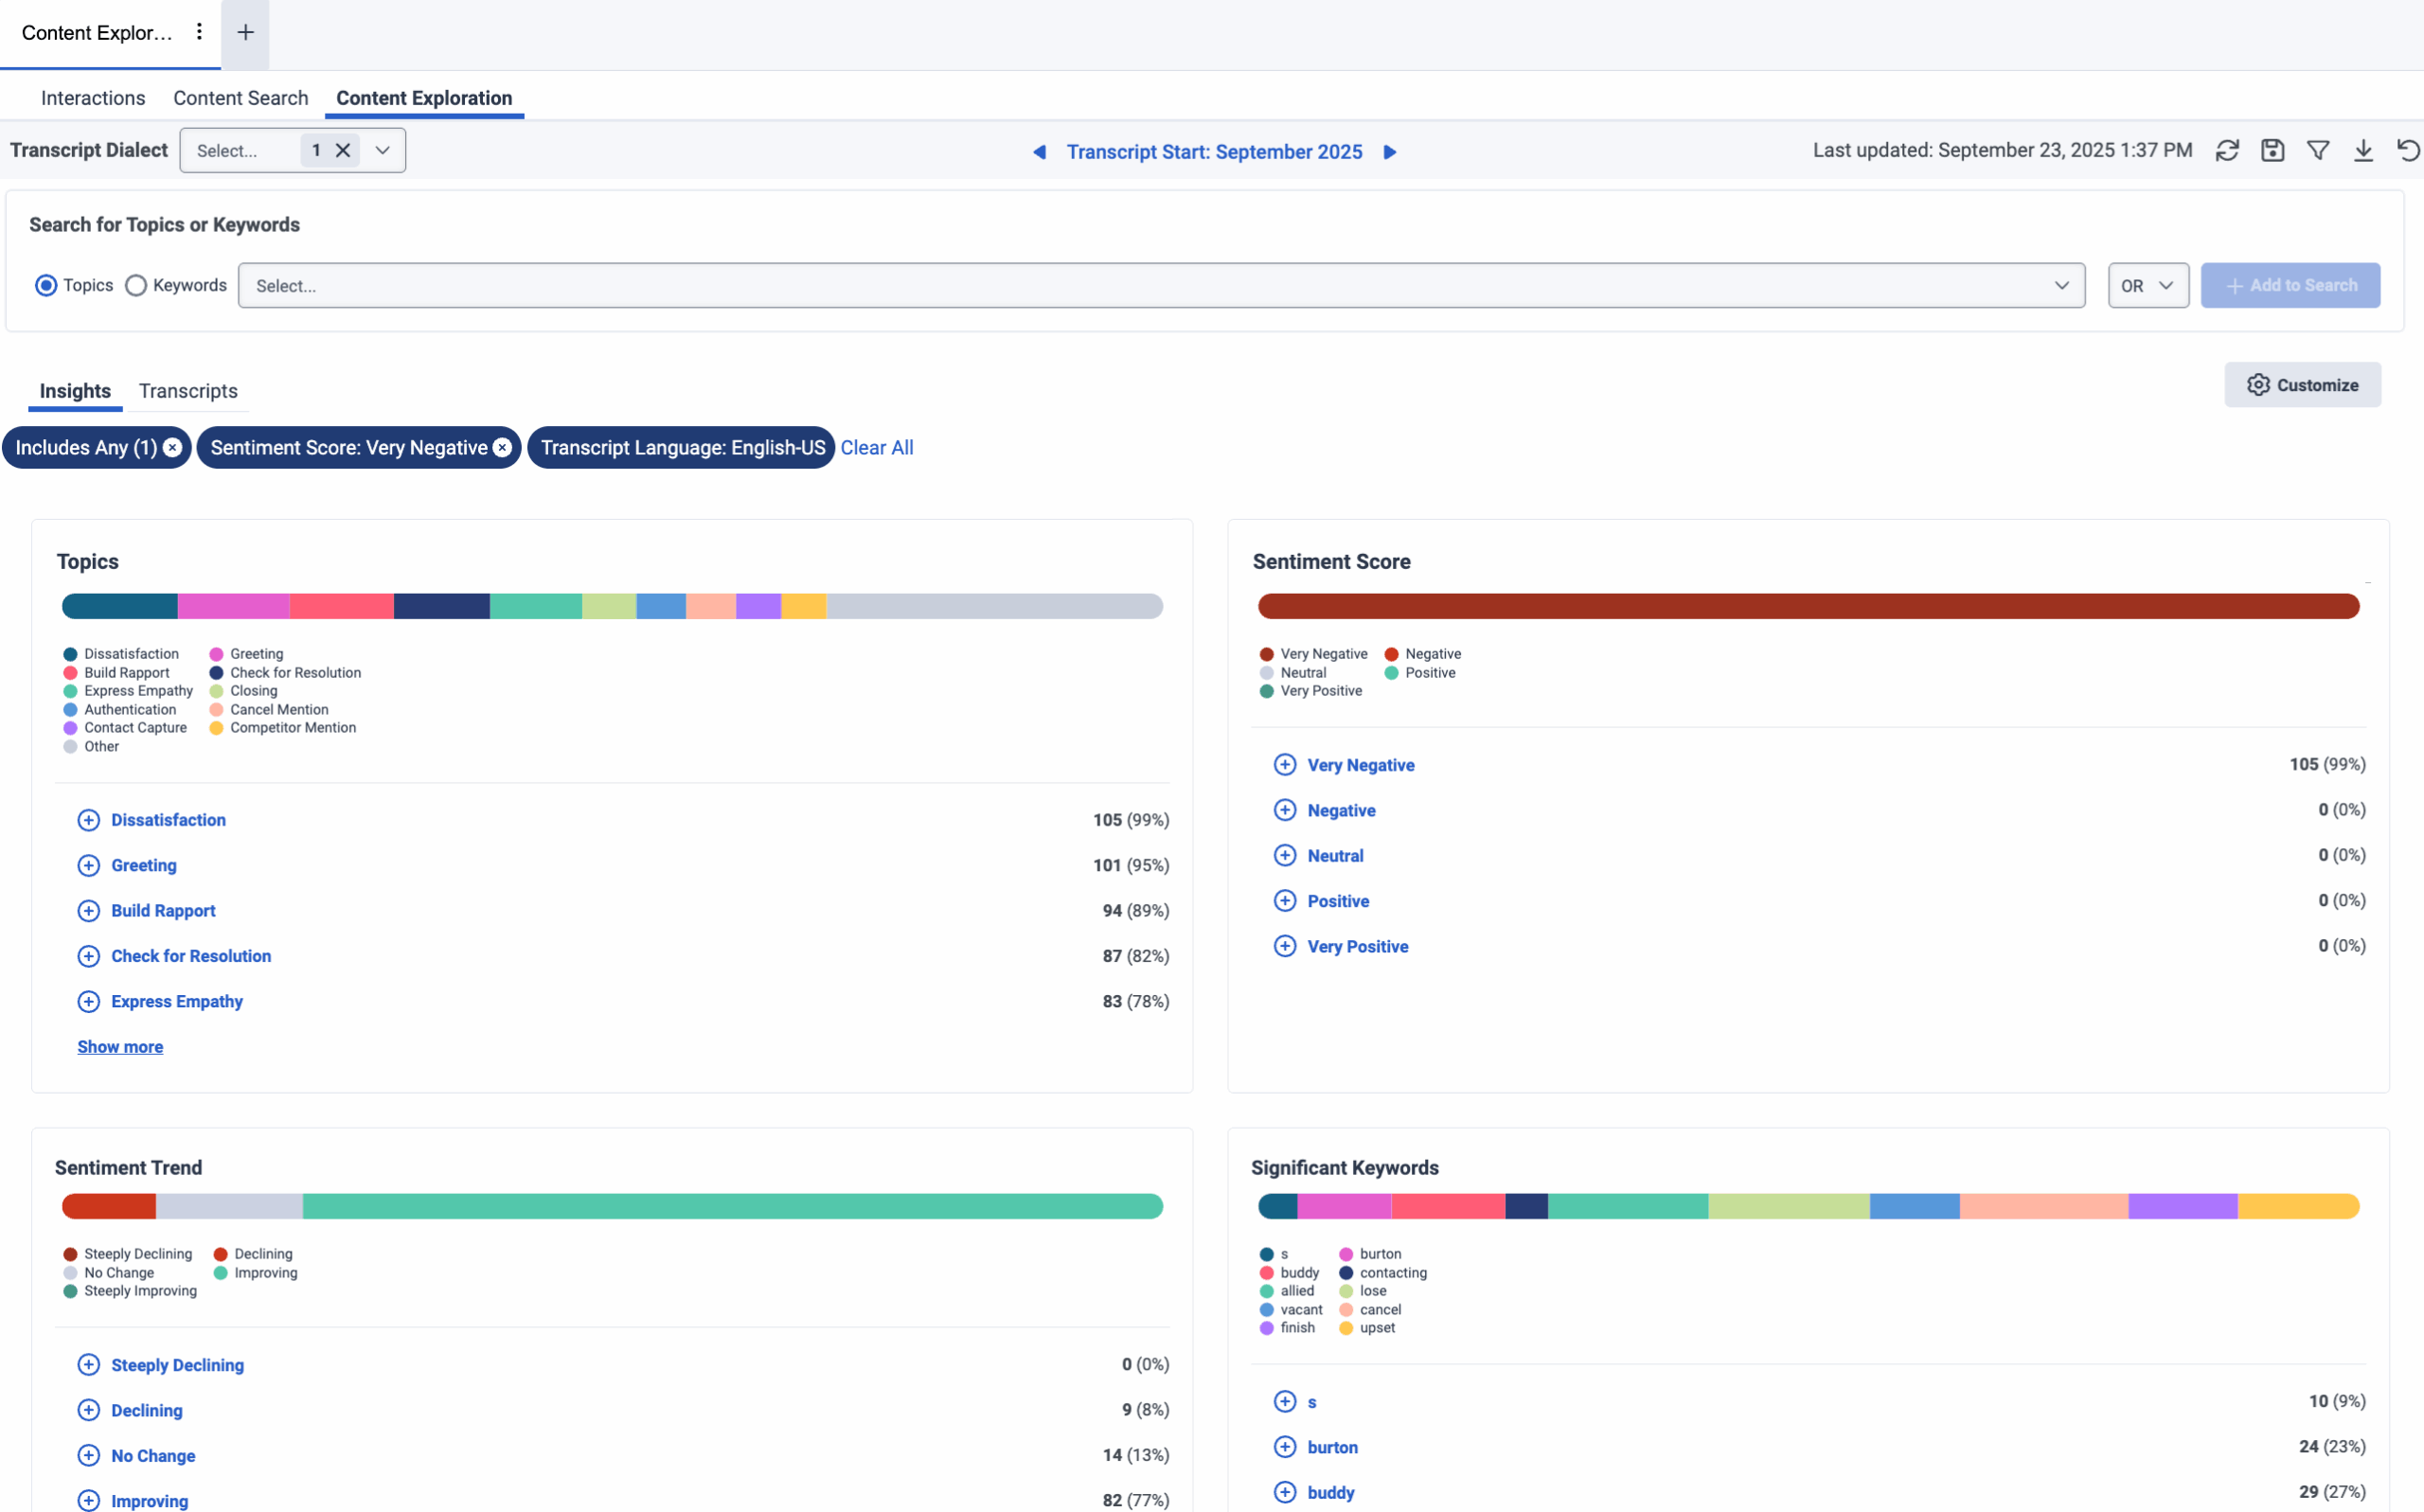
La vista de exploración de contenidos permite a los analistas de negocio visualizar y explorar los datos de transcripción y obtener información valiosa de las interacciones con los clientes. Esta vista ofrece una visión completa de los temas de conversación, análisis de empatía, análisis de sentimiento y tendencias para ayudar a comprender el compromiso del cliente.
Esta vista permite a los analistas de negocio entender lo que los clientes y los agentes están discutiendo, identificar tendencias y realizar análisis de causa raíz para mejorar la experiencia del cliente, el rendimiento de los agentes, el rendimiento del negocio, los procesos de negocio y la satisfacción del cliente.
Para explorar el contenido, haga clic en Rendimiento > Espacio de trabajo > Análisis de voz y texto > Exploración del contenido.
Para explorar el contenido, realice lo siguiente:
- Haga clic en Menú > Análisis > Espacio de trabajo de análisis.
- En la sección Default, busque Content Exploration y haga clic en el nombre de la vista para abrirla.
Para ver los datos más actuales, pulse Actualizar . Para guardar la vista con la configuración de filtros y columnas, haga clic en Guardar .
Para exportar los datos de la vista, haga clic en Alternar panel de exportación .
Haga clic en Restablecer vista por defecto para realizar lo siguiente:
- Restablece la personalización de las tarjetas y los filtros en la pestaña Insights.
- Restablecer los filtros y columnas de la pestaña Transcripciones.
- Visualice la pestaña Insights si tiene abierta la pestaña Transcripts.
Columnas disponibles
- To view the available columns, see the Vista de exploración de contenidos section in the View available columns in performance views by category article.
- Para ver la lista consolidada de columnas disponibles en las vistas de rendimiento, consulte Vista consolidada de columnas disponibles en las vistas de rendimiento.
- Para ver la lista de columnas disponibles en las vistas de rendimiento por categoría, consulte Ver columnas disponibles en las vistas de rendimiento por categoría.
Filtrar contenidos en la vista de exploración de contenidos
- Para personalizar las vistas de análisis, utilice el filtro de fechas.
- Para filtrar las métricas por fecha o configurar un intervalo de fechas personalizado, utilice los preajustes.
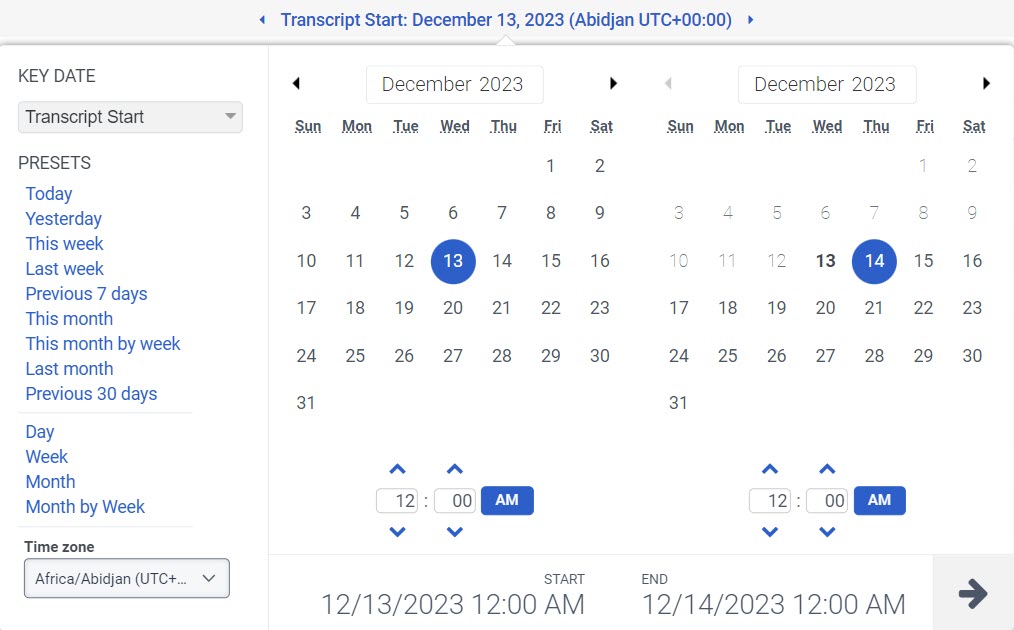
- Para usar un ajuste preestablecido para filtrar métricas, complete los siguientes pasos:
-
- Haga clic en la fecha para mostrar el filtro de fecha.
- En FECHA CLAVE seleccione Inicio de Transcripción o Inicio de Conversación.
- En la lista Preestablecidos, seleccione una opción de fecha preestablecida.
Ajustes preestablecidos de fecha
| Preajustes | Descripción |
|---|---|
|
Inicio de la transcripción |
Ordena los resultados de la búsqueda según el momento en que comienza la transcripción. |
|
Inicio de conversación |
Ordena los resultados de la búsqueda según el momento en que se inicia la conversación. |
| Hoy dia | Muestra datos para el período de tiempo que incluye el intervalo actual. |
| El dia de ayer | Muestra datos del día anterior. |
| Esta semana | Muestra datos para un período de tiempo de domingo a sábado. |
| La semana pasada | Muestra datos de la semana anterior, de domingo a sábado. |
| 7 días anteriores | Muestra datos de los siete días anteriores. |
| Este mes | Muestra los datos del mes actual, sin días adicionales. |
| Este mes a semana | Muestra datos para el mes calendario actual que comienza el domingo y termina el sábado, incluidos los días adicionales si el mes no comienza el domingo ni termina el sábado. |
| El mes pasado | Muestra datos del mes calendario anterior sin días adicionales. |
| 30 días anteriores | Muestra datos de los 30 días anteriores. |
| Día | Muestra datos para un solo día de 24 horas. |
| Semana | Muestra datos para un período de tiempo de domingo a sábado. |
| Mes | Muestra datos para el mes exacto sin días adicionales. Si se selecciona el mes actual, verá los datos hasta la fecha actual. |
| Mes a semana | Muestra datos para un mes calendario que comienza el domingo y termina el sábado, incluidos los días adicionales si el mes no comienza el domingo ni termina el sábado. |
- Para usar un rango de fechas personalizado para filtrar métricas, complete los siguientes pasos:
-
- Haga clic en la fecha para mostrar el filtro de fecha.
- Seleccione una fecha de inicio y una fecha de fin en el calendario y haga clic en la flecha de filtrado .
- Para ver los datos de un periodo de tiempo diferente utilizando las mismas fechas predefinidas, haga clic en las flechas situadas a ambos lados de la visualización de la fecha. Por ejemplo, para ver los datos del día anterior, haga clic en el preajuste Day y, a continuación, haga clic en la flecha situada a la izquierda de la fecha.
- Para ver los datos de una zona horaria diferente utilizando las mismas fechas preestablecidas, en el menú desplegable Zona horaria, seleccione la zona horaria deseada. Puede crear y guardar informes con la misma zona horaria seleccionada.
Para filtrar las interacciones para transcripciones en el idioma seleccionado, haga clic en el menú desplegable Transcript Dialect y elija el dialecto de transcripción requerido.
Utilice la barra de búsqueda para encontrar temas específicos o palabras clave dentro de sus transcripciones. A continuación, añada un tema o una palabra clave y aplique Add to Search para actualizar los datos y mostrar información correlacionada para descubrir tendencias. Las tendencias pueden incluir temas que aparecen juntos, las palabras clave que son tendencia cuando el sentimiento del cliente es negativo y las palabras clave más habladas en una cola.
Para filtrar las interacciones que contienen temas específicos en una transcripción, realice lo siguiente:
- En la sección Búsqueda de temas o palabras clave, seleccione Temas.
- En la barra de búsqueda, seleccione el tema deseado.
- Elija uno de los siguientes operadores: OR, AND, or NOT.
- Haga clic en Añadir a la búsqueda.
- Por defecto, el operador OR está activado.
- Los operadores AND, OR y NOT se aplican a los temas o palabras clave de un mismo grupo. Por ejemplo, Tema A Y Tema B.
- Los distintos grupos siempre se AND. Por ejemplo, (Tema A O Tema B) Y (Palabra clave 1 Y Palabra clave 2) Y (NO Tema C Y NO Tema D).
- Si se crea un grupo utilizando el operador NOT, los miembros del grupo se niegan y se unen. Por ejemplo, considere un filtro de temas con el grupo NOT G que incluye tres temas: tema A, tema B y tema C. La vista muestra datos que no están relacionados con el tema A, el tema B y el tema C. Es decir, NOT A AND NOT B AND NOT C.
Para filtrar las interacciones que contienen palabras clave específicas en una transcripción, realice lo siguiente:
- En la sección Búsqueda de temas o palabras clave, seleccione Palabras clave.
- En la barra de búsqueda, introduzca la palabra o palabras deseadas.
- Elija uno de los siguientes tipos de concordancia de palabras clave:
- Correspondencia exacta: Filtra las interacciones con la palabra o frase exacta.
- Similar To: Filtrar las interacciones con la palabra o frase similar a la palabra clave buscada.
Nota: Por defecto, la opción Coincidencia exacta está activada.
- Elija uno de los siguientes operadores: OR, AND, or NOT.
- Haga clic en Añadir a la búsqueda.
- Por defecto, el operador OR está activado.
- Los operadores AND, OR y NOT se aplican al mismo nivel.
- Si se crea un grupo utilizando el operador NOT, los miembros del grupo se niegan y se unen. Por ejemplo, considere un filtro de palabras clave con el grupo NOT G que incluye tres palabras clave: palabra clave A, palabra clave B y palabra clave C. La vista muestra los datos que no están relacionados con la palabra clave A, la palabra clave B y la palabra clave C. Es decir, NOT A Y NOT B Y NOT C.
- Puede buscar hasta 1000 registros de interacciones.
- Puede buscar palabras o frases en las transcripciones durante un máximo de 90 días desde la fecha de la interacción o buscar temas y puntuaciones de sentimiento durante un máximo de 1,5 años desde la fecha de la interacción. Como el selector de intervalos de fechas de la interfaz de usuario sigue estando limitado a 30 días, deberá revisar los resultados de la búsqueda de 30 en 30 días.
Para aplicar los filtros a las interacciones de interés:
- Haga clic en Alternar panel de filtros .
- Seleccione el archivo JSON que desea utilizar.
Filtros de exploración de contenidos
| Filtro | Descripción |
|
Temas |
Filtra las interacciones asociadas al tema seleccionado. |
|
Palabras clave significativas |
Filtra las interacciones asociadas a la palabra clave seleccionada. |
|
Colas |
Muestra las 10 colas principales. Filtra las interacciones asociadas a la cola seleccionada. |
| Divisiones | Muestra las 10 primeras divisiones. Filtra las interacciones asociadas a la división seleccionada. |
|
Tipos de medios |
Filtra las interacciones asociadas a los tipos de medios seleccionados, incluidos Correo electrónico, Voz, y Mensaje. |
|
Flujos |
Muestra los 10 flujos principales. Filtra las interacciones asociadas a los flujos IVR seleccionados. |
|
Tendencia de sentimiento |
Filtre las interacciones en función del sentimiento general del cliente, de -100 a +100. Las categorías de tendencias de sentimiento son:
|
|
Puntuación de empatía |
Filtre las interacciones en función de la puntuación global de empatía del agente, que oscila entre -100 y +100. Las categorías de puntuación de empatía son:
|
|
Puntuación de sentimiento |
Filtre las interacciones en función del sentimiento general del cliente, de -100 a +100. Las categorías de puntuación del sentimiento son:
|
Pestañas de la vista de exploración de contenidos
La pestaña Insights está abierta por defecto y proporciona una visión general de alto nivel de las interacciones de su centro de contacto a través de los siguientes widgets:
- Temas
- Puntuación de sentimiento
- Tendencia de sentimiento
- Palabras clave significativas
- Puntuación de empatía
Temas
El widget de temas muestra la distribución porcentual de los cinco temas más comunes detectados en sus interacciones.
Puntuación de sentimiento
El widget de puntuación del sentimiento analiza el tono emocional de las conversaciones y muestra las interacciones en función de la puntuación general del sentimiento del cliente, que oscila entre -100 y +100. Esta puntuación pondera todos los marcadores positivos y negativos a lo largo de la interacción. Para destacar la experiencia de despedida del cliente con el centro de contacto, se concede más peso a los eventos que tienen lugar hacia el final de la interacción. El analista puede utilizar la puntuación del sentimiento para profundizar en las interacciones de interés.
Las categorías de puntuación del sentimiento son:
- Muy negativo (-20 a -100)
- Negativo (-1 a -19)
- Neutral (-0,9 a +0,9)
- Positivo (+1 a +19)
- Muy positiva (+20 a +100)
Haz clic en cualquier categoría de sentimiento para filtrar las conversaciones por ese nivel de sentimiento.
Tendencia de sentimiento
El widget de tendencias de sentimiento muestra las tendencias de las interacciones en función de la puntuación general de sentimiento del cliente, que oscila entre -100 y +100. Esta puntuación pondera todos los marcadores positivos y negativos a lo largo de la interacción. Para destacar la experiencia de despedida del cliente con el centro de contacto, se otorga más peso a los eventos que tuvieron lugar hacia el final de la interacción. Este widget se utiliza para identificar si la satisfacción del cliente está mejorando o empeorando durante las interacciones.
Las categorías de tendencias de sentimiento son:
- En fuerte descenso (-21 a -54)
- En descenso (-55 a -100)
- Sin cambios (de -20 a +20)
- Mejora (de +55 a +100)
- En franca mejoría (+21 a +54)
Palabras clave significativas
El widget de palabras clave significativas muestra los términos estadísticamente significativos que aparecen en sus transcripciones y la tendencia de las cinco palabras clave principales encontradas en las interacciones. Este widget ayuda a identificar términos comunes que indican tendencias o problemas.
Puntuación de empatía
El widget de puntuación de empatía mide los niveles de empatía del agente durante las interacciones y muestra las interacciones en función de la puntuación global de empatía del agente, que oscila entre -100 y +100. Esta puntuación mide el nivel de empatía e inteligencia emocional de un agente durante las interacciones con los clientes. Esta puntuación refleja la capacidad del agente para comprender y relacionarse con las emociones y preocupaciones del cliente. Para obtener más información sobre el análisis de la empatía del agente, consulte Acerca del análisis de la empatía del agente.
Las categorías de puntuación de empatía son:
- Poco útil (-1 a -100)
- Neutral (-0,9 a +0,9)
- Empático (+1 a +100)
Este widget ayuda a evaluar la eficacia con la que los agentes responden a las necesidades de los clientes.
Personalizar la información
Personaliza la pestaña de información añadiendo o eliminando widgets.
Para personalizar la pestaña Insights, realice lo siguiente:
- En la parte derecha de la pestaña Insights, haga clic en Personalizar.
- Seleccione o anule la selección de los widgets necesarios, incluidos Temas, Puntuación de sentimiento, Tendencia de sentimiento, Palabras clave significativas, y Puntuación de empatía.
La pestaña de transcripciones de Exploración de contenidos muestra una lista de transcripciones que coinciden con los filtros aplicados.
Haga clic en el usuario deseado para ver los detalles de la transcripción en la página interactions detail view. Para más información sobre transcripciones, consulta Trabajar con una transcripción de voz.
Para mostrar u ocultar columnas:
- En la esquina superior derecha de las columnas, haga clic en el icono Pick columns . Aparecerá el panel Add/Remove Column.
- Haga clic en la pestaña Administrar columnas.
- (Opcional) Para ordenar las columnas en orden ascendente o alfabético, haga clic en Ordenar por > Nombre de columna A-Z.
- (Opcional) Para ordenar las columnas en orden alfabético descendente o inverso, haga clic en Ordenar por > Nombre de columna Z-A.
- (Opcional) Para categorizar o descategorizar las columnas, haga clic en Ordenar por y active o desactive el conmutador Agrupar por categorías .
- Busque o desplácese para seleccionar las columnas que desea ver. Nota: También puede utilizar la navegación por teclado para elegir las columnas.
- Hacer clic Ahorrar. Las columnas seleccionadas aparecen en la pantalla. Nota: Las selecciones de columna aparecen sólo después de guardar los cambios y no se aplican a la tabla inmediatamente.
Para reordenar las columnas dentro del selector de columnas:
- En la esquina superior derecha de las columnas, haga clic en el icono Pick columns . Aparecerá el panel Add/Remove Column (selector de columnas).
- Haga clic en la pestaña Reordenar columnas.
- Haga clic en el icono de cuadrícula
 de una columna y, a continuación, arrastre y suelte para reordenarla dentro del selector de columnas.
- Haga clic para seleccionar el icono de cuadrícula de la columna que desea reordenar y, en el teclado, pulse la barra espaciadora.
- Para posicionar la columna, utilice las teclas de flecha arriba o abajo.
- Pulse la barra espaciadora. Se reordena la columna elegida.
Para reorganizar las columnas fuera del selector de columnas, haga clic en la cabecera de una columna y arrástrela.
Para restablecer una vista a la configuración predeterminada de las columnas, haga clic en Restablecer vista a valores predeterminados .
Puede seleccionar hasta 20 columnas.