
Vista detallada de la cola de enrutamiento predictivo
La vista detallada de una cola individual presenta diferentes aspectos del rendimiento de la cola seleccionada. La página contiene las siguientes pestañas:
- Resumen - Abre la vista detallada de colas que resume el impacto del enrutamiento predictivo para el periodo seleccionado. Encontrará más información sobre la pestaña de visión general en las secciones siguientes de esta página.
- Modelo predictivo - Presenta las principales características que contribuyen a las decisiones de enrutamiento de la cola seleccionada. Para obtener más información, consulte Ver funciones que influyeron en las decisiones de enrutamiento predictivo.
La vista de detalle de la cola contiene métricas sobre el impacto del enrutamiento predictivo para el periodo seleccionado.
Establecer una zona horaria por defecto en el espacio de trabajo
Puede establecer la zona horaria predeterminada en el espacio de trabajo de análisis antes de visualizar cualquier vista de análisis.
Para establecer la zona horaria por defecto en el área de trabajo, siga estos pasos:
- Hacer clic Rendimiento > Espacio de trabajo.
- Haga clic en Menú > Análisis > Espacio de trabajo de análisis.
- A la izquierda, en el menú desplegable Zona horaria, seleccione la zona horaria deseada como zona horaria por defecto para el espacio de trabajo de análisis.
Para ver los detalles de una cola específica view, vaya a Performance > Workspace > Contact Center > Predictive routing, y en la lista, haga clic en el nombre de la cola específica.
Para ver detalles sobre una cola específica vista, realice lo siguiente:
- Haga clic en Menú > Análisis > Espacio de trabajo de análisis.
- En la sección Default, busque Predictive Routing y haga clic en el nombre de la vista para abrirla.
- Haga clic en el nombre de la cola específica.
Para obtener más información, consulte Predictive routing queue impact view.
Los detalles de una cola específica dependen del KPI que elija.
Utilice el KPI Tiempo medio de gestión para visualizar los siguientes detalles.
| Detalle | Descripción | Notas (Como referencia, consulte la imagen) |
|---|---|---|
|
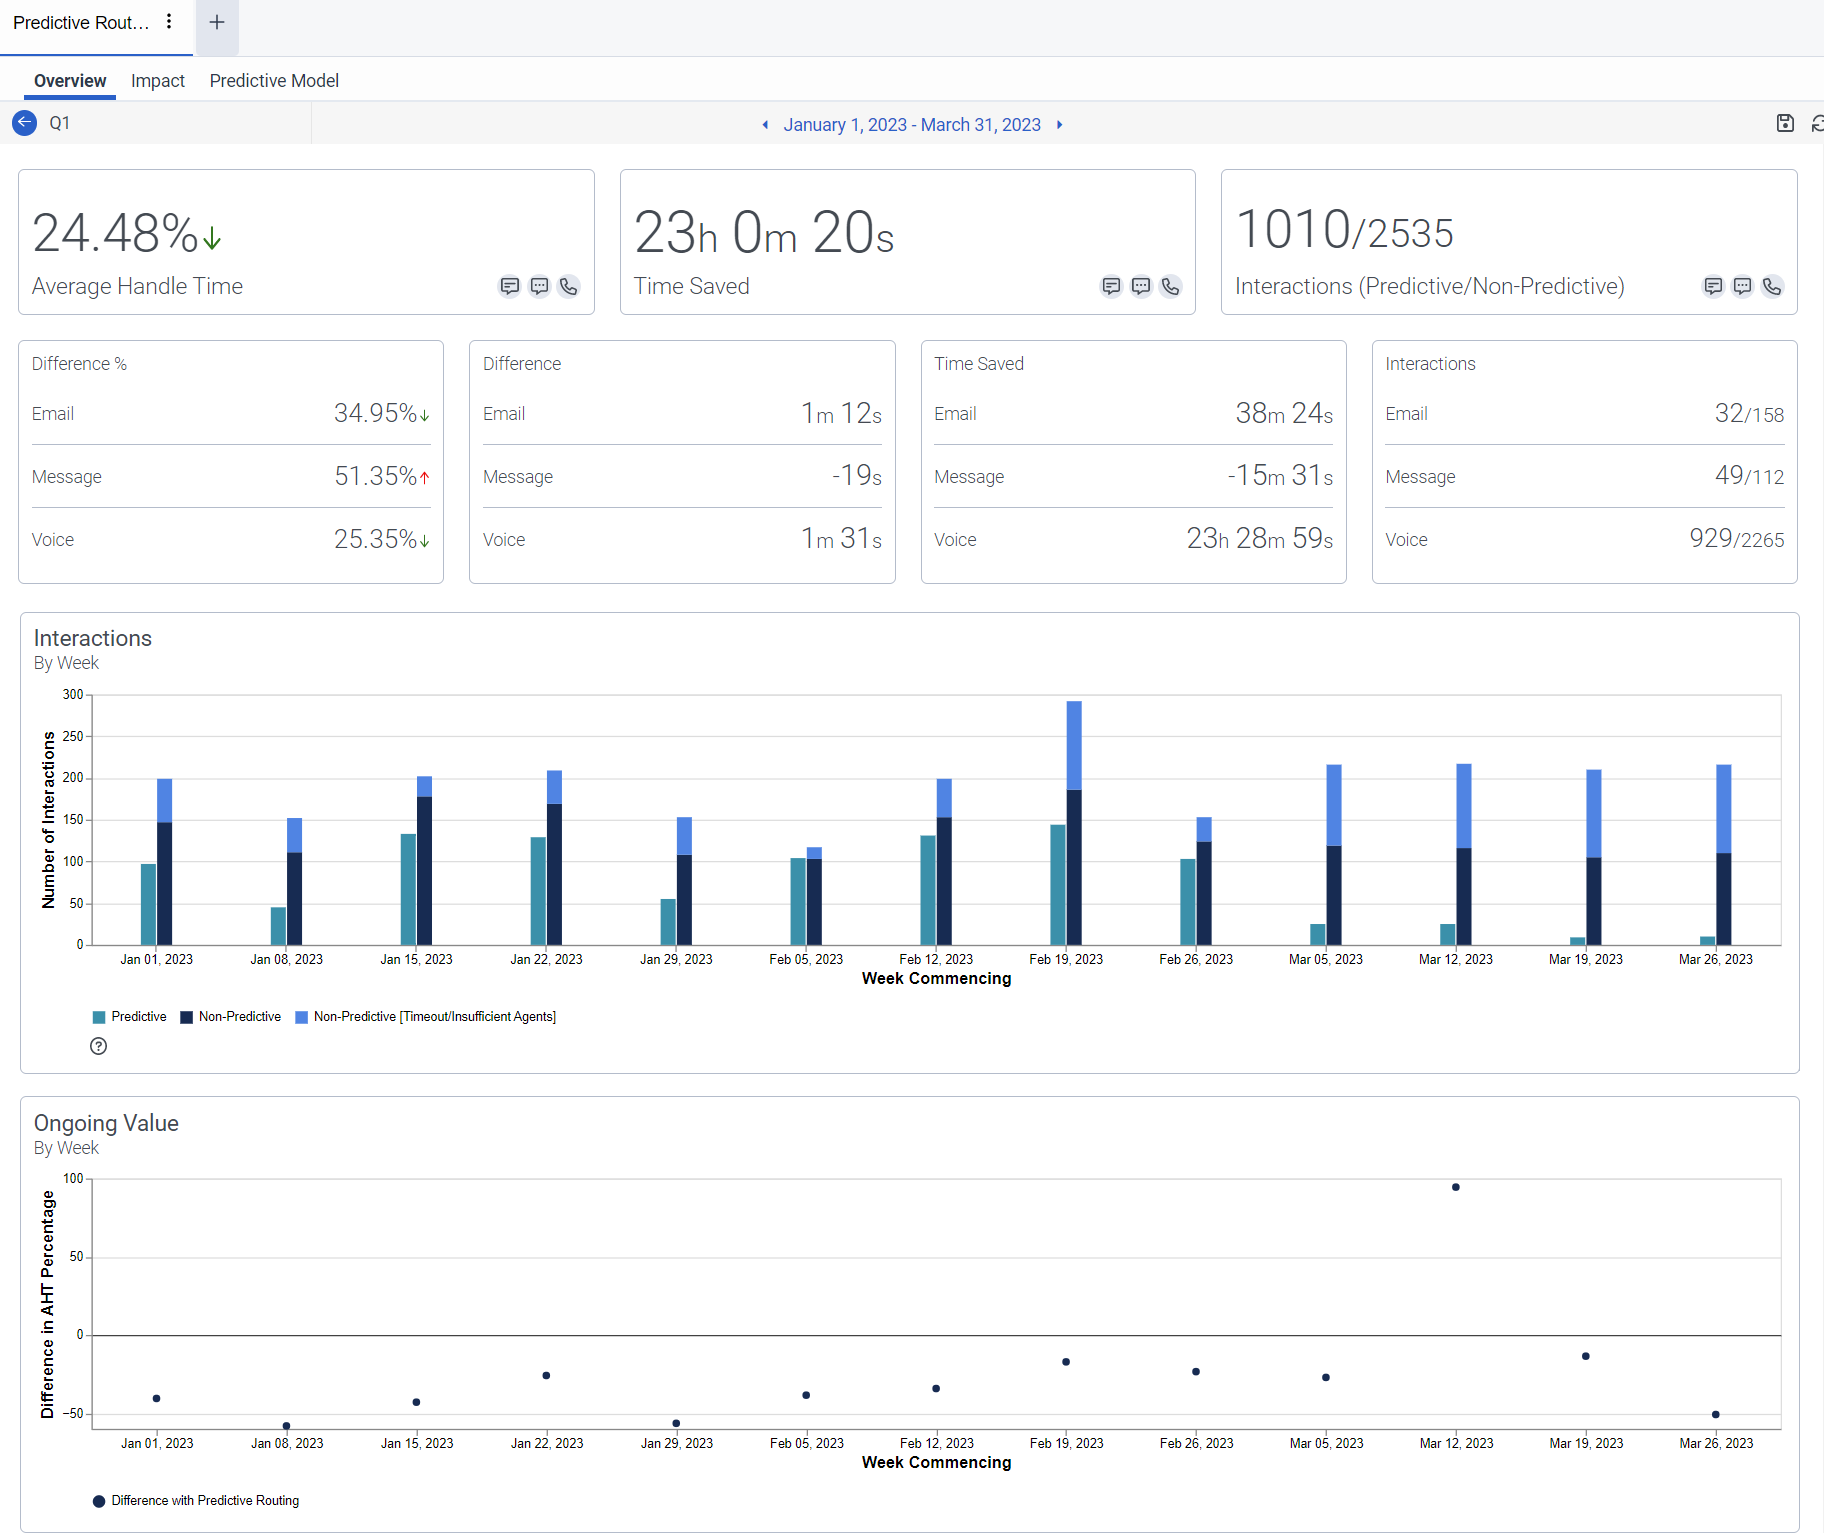
Tiempo medio de manipulación (AHT Diferencia %) |
Indica la diferencia porcentual en la cantidad de tiempo de gestión de las interacciones que se enrutaron utilizando el enrutamiento predictivo en comparación con la cantidad de tiempo de gestión de las interacciones que se enrutaron utilizando métodos de enrutamiento no predictivos durante el periodo de tiempo seleccionado. |
Cuando una cola admite más de un tipo de soporte, aparece un desglose del % de diferencia AHT por tipo de soporte además del valor % de diferencia AHT. El % de diferencia AHT no coincide con la suma o media del % de cada tipo de soporte. |
| Diferencia AHT |
Indica la diferencia en el valor AHT entre las interacciones que enrutó utilizando enrutamiento predictivo y las interacciones que enrutó sin enrutamiento predictivo, durante el intervalo de fechas seleccionado por interacción. Este valor aparece en horas, minutos y segundos. |
El valor de la diferencia de AHT sólo se muestra para una cola de tipo de medio específica (única). Si una cola incluye más de un tipo de soporte, aparece un desglose de la diferencia AHT por tipo de soporte. |
| Tiempo ahorrado |
Indica la cantidad de tiempo de gestión que se ahorra al utilizar el enrutamiento predictivo durante el período de tiempo seleccionado. El tiempo ahorrado se calcula multiplicando el número total de interacciones, utilizando el enrutamiento predictivo, por la diferencia AHT para el intervalo de fechas especificado. |
Cuando una cola admite más de un tipo de soporte, también aparece un desglose de los datos según el tipo de soporte debajo de la tabla Tiempo guardado. |
| Interacciones |
Indica el número total de interacciones que enrutó con enrutamiento predictivo, en comparación con el número gestionado por otros métodos de enrutamiento. Por ejemplo, en la imagen de cola de medios única que aparece a continuación, 1010 es el número total de interacciones que se enrutaron con enrutamiento predictivo, y 2535 es el número total de interacciones gestionadas sin enrutamiento predictivo. |
Cuando una cola admite más de un tipo de soporte, también aparece un desglose de los datos según el tipo de soporte. Si el número de interacciones de cualquier tipo de medio es cero, el número total de interacciones difiere, ya que el valor cero no se tiene en cuenta para el total. |
| Gráfico de barras de las interacciones |
Muestra los volúmenes de enrutamiento predictivo y no predictivo para el intervalo de fechas seleccionado en intervalos semanales. Si Genesys Cloud no encuentra ningún agente cualificado antes de que se agote el tiempo de enrutamiento predictivo, o si el número de agentes en la cola es de tres o menos, la interacción se enruta a través de enrutamiento estándar, que es el método de enrutamiento alternativo. Para más información sobre el proceso de selección de agentes, consulte la página Proceso de selección de agentes. |
La primera semana mostrada en el gráfico comienza a partir del primer día del intervalo de fechas seleccionado. La última semana es una semana completa o parcial, según el intervalo de fechas seleccionado. La barra No predictivo (tiempo de espera/agentes insuficientes) representa todas las interacciones en las que Genesys Cloud intentó un enrutamiento predictivo pero en su lugar utilizó métodos de enrutamiento no predictivos. |
| Valor en curso (Diferencia AHT % Gráfico de dispersión) |
Este gráfico de dispersión muestra los valores semanales de % de diferencia AHT por encima o por debajo de una línea cero. Un punto en la línea cero indica que el enrutamiento predictivo no supuso una diferencia en el AHT de las interacciones predictivas en comparación con las interacciones no predictivas. Los valores positivos por encima de la línea cero indican que las interacciones enrutadas utilizando el enrutamiento predictivo tienen, por término medio, un tiempo de gestión más largo que las interacciones enrutadas sin enrutamiento predictivo. Los valores por debajo de la línea cero indican que las interacciones enrutadas utilizando el enrutamiento predictivo tienen un tiempo de gestión más corto que las interacciones enrutadas sin enrutamiento predictivo. Para ver los datos de esa fecha concreta, pase el ratón por encima de uno de los puntos del gráfico. |
La primera semana mostrada en el gráfico comienza a partir del primer día del intervalo de fechas seleccionado. La última semana es una semana completa o parcial, según el intervalo de fechas seleccionado. |
Utilice el KPI Evitar siguiente contacto para mostrar los siguientes detalles.
| Detalle | Descripción | Notas (Como referencia, consulte la imagen) |
|---|---|---|
|
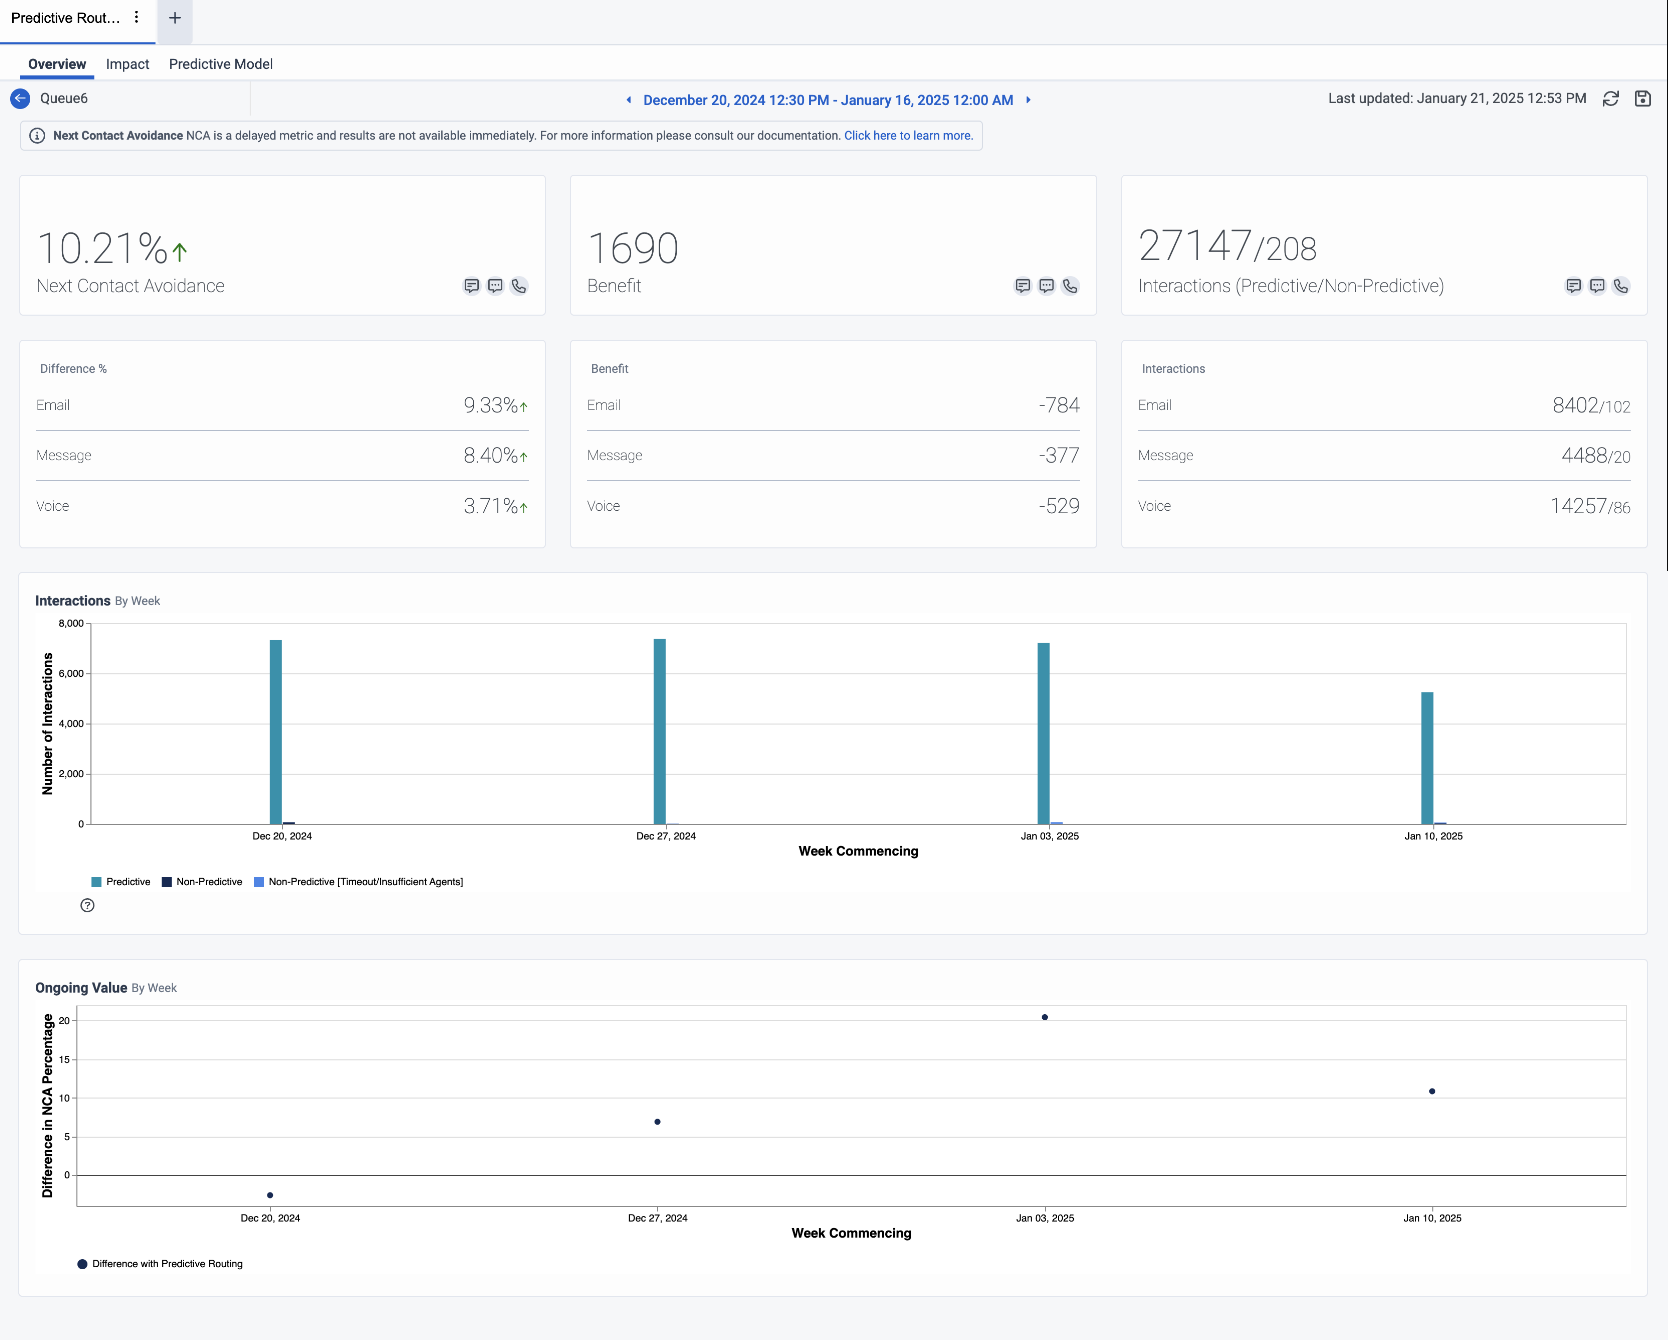
Evitación del próximo contacto (Diferencia NCA %) |
Indica la diferencia porcentual en el número de interacciones de repetición de contacto evitadas que se enrutaron utilizando enrutamiento predictivo en comparación con el número de interacciones de repetición de contacto evitadas que se enrutaron utilizando métodos de enrutamiento no predictivos durante el periodo de tiempo seleccionado. |
Cuando una cola admite más de un tipo de soporte, aparece un desglose del % de diferencia de NCA por tipo de soporte, además del valor del % de diferencia de NCA. El % de diferencia NCA no coincide con la suma o la media del % de cada tipo de medio. |
| Beneficio |
Indica el número de interacciones repetidas que evitan el contacto al utilizar el enrutamiento predictivo durante el periodo de tiempo seleccionado. El beneficio se calcula en función del número de contactos repetidos evitados. |
Cuando una cola admite más de un tipo de soporte, también aparece debajo de la tabla de prestaciones un desglose de los datos según el tipo de soporte. |
| Interacciones |
Indica el número total de interacciones que se enrutaron con enrutamiento predictivo en comparación con el número gestionado por otros métodos de enrutamiento. Por ejemplo, en la imagen de cola de medios única que aparece a continuación, 27147 es el número total de interacciones que se enrutaron con enrutamiento predictivo, y 208 es el número total de interacciones gestionadas sin enrutamiento predictivo. |
Cuando una cola admite más de un tipo de soporte, también aparece un desglose de los datos según el tipo de soporte. Si el número de interacciones de cualquier tipo de medio es cero, el número total de interacciones difiere, ya que Genesys Cloud no considera el valor cero para el total. |
| Gráfico de barras de las interacciones |
Muestra los volúmenes de enrutamiento predictivo y no predictivo para el intervalo de fechas seleccionado en intervalos semanales. Si Genesys Cloud no encuentra ningún agente cualificado antes de que se agote el tiempo de enrutamiento predictivo, o si el número de agentes en la cola es de tres o menos, la interacción se enruta a través de enrutamiento estándar, que es el método de enrutamiento alternativo. Para más información sobre el proceso de selección de agentes, consulte la página Proceso de selección de agentes. |
La primera semana mostrada en el gráfico comienza a partir del primer día del intervalo de fechas seleccionado. La última semana es una semana completa o parcial, según el intervalo de fechas seleccionado. La barra No predictivo (tiempo de espera/agentes insuficientes) representa todas las interacciones en las que Genesys Cloud intentó un enrutamiento predictivo pero en su lugar utilizó métodos de enrutamiento no predictivos. |
| Valor actual (NCA Diferencia % Gráfico de dispersión) |
Este gráfico de dispersión muestra los valores semanales de % de diferencia NCA por encima o por debajo de una línea cero. Un punto en la línea cero indica que el enrutamiento predictivo no supuso una diferencia en el NCA de las interacciones predictivas en comparación con las interacciones no predictivas. Los valores positivos por encima de la línea cero indican que el rendimiento del enrutamiento predictivo mejoró. Los valores negativos por debajo de la línea cero indican que el enrutamiento predictivo no proporciona mejores resultados que otros métodos de enrutamiento. Para ver los datos de esa fecha concreta, pase el ratón por encima de uno de los puntos del gráfico. |
La primera semana mostrada en el gráfico comienza a partir del primer día del intervalo de fechas seleccionado. La última semana es una semana completa o parcial, según el intervalo de fechas seleccionado. |
- Para cambiar el periodo de tiempo, haga clic en la fecha en la parte superior de la vista y seleccione una fecha diferente.
- Para volver a la lista de enrutamiento predictivo, haga clic en el siguiente icono de retroceso situado junto a la cola ver nombre
 .
.