Optimice la experiencia del cliente de forma proactiva
Genesys Cloud ofrece un conjunto ampliado de capacidades que puede utilizar para obtener información sobre el recorrido de sus clientes. Estas herramientas le ayudarán en lo siguiente
- Le permite obtener una visión completa y multicanal de los recorridos de sus clientes.
- Le permite seguir, analizar y optimizar cada paso de la experiencia del cliente.
- Proporciona visualizaciones dinámicas y mapas de calor que revelan los niveles de compromiso de los clientes en todos los componentes del flujo Architect.
- Permite obtener información inmediata sobre las zonas de mayor tráfico y las interacciones.
Con vistas granulares y de alto nivel, puede utilizar Flow Insights, Journey Flows y Replay Mode para sumergirse en componentes específicos del flujo de Architect y realizar lo siguiente:
- Medir el rendimiento del flujo.
- Supervisar las frecuencias de los hitos clave del flujo.
- Comprender cómo progresan los clientes hacia los resultados de flujo deseados.
- Visualice los caminos que toman los clientes, captando tanto las rutas exitosas como las difíciles.
Utilice Journey Management para ampliar su visión más allá de los flujos de arquitectura de un solo canal con 365 días de datos de canales cruzados y haga lo siguiente:
- Realizar análisis de tendencias y embudos.
- Realice un seguimiento del rendimiento del viaje a lo largo del tiempo.
- Identifique rápidamente los cambios en las métricas de su recorrido.
- Identificar los puntos de fricción en las transiciones multicanal.
- Perfeccione la experiencia del cliente.
- Mejore la satisfacción del cliente en todos los puntos de contacto.
Obtenga información detallada sobre el recorrido de sus clientes con Flow Insights:
Principales ventajas
Casos clave detallados
Información práctica
- En la página de inicio de Architect, haga clic o pase el ratón por encima del menú Flows y seleccione el tipo de flujo deseado.
- Haga clic en el flujo que desea analizar.
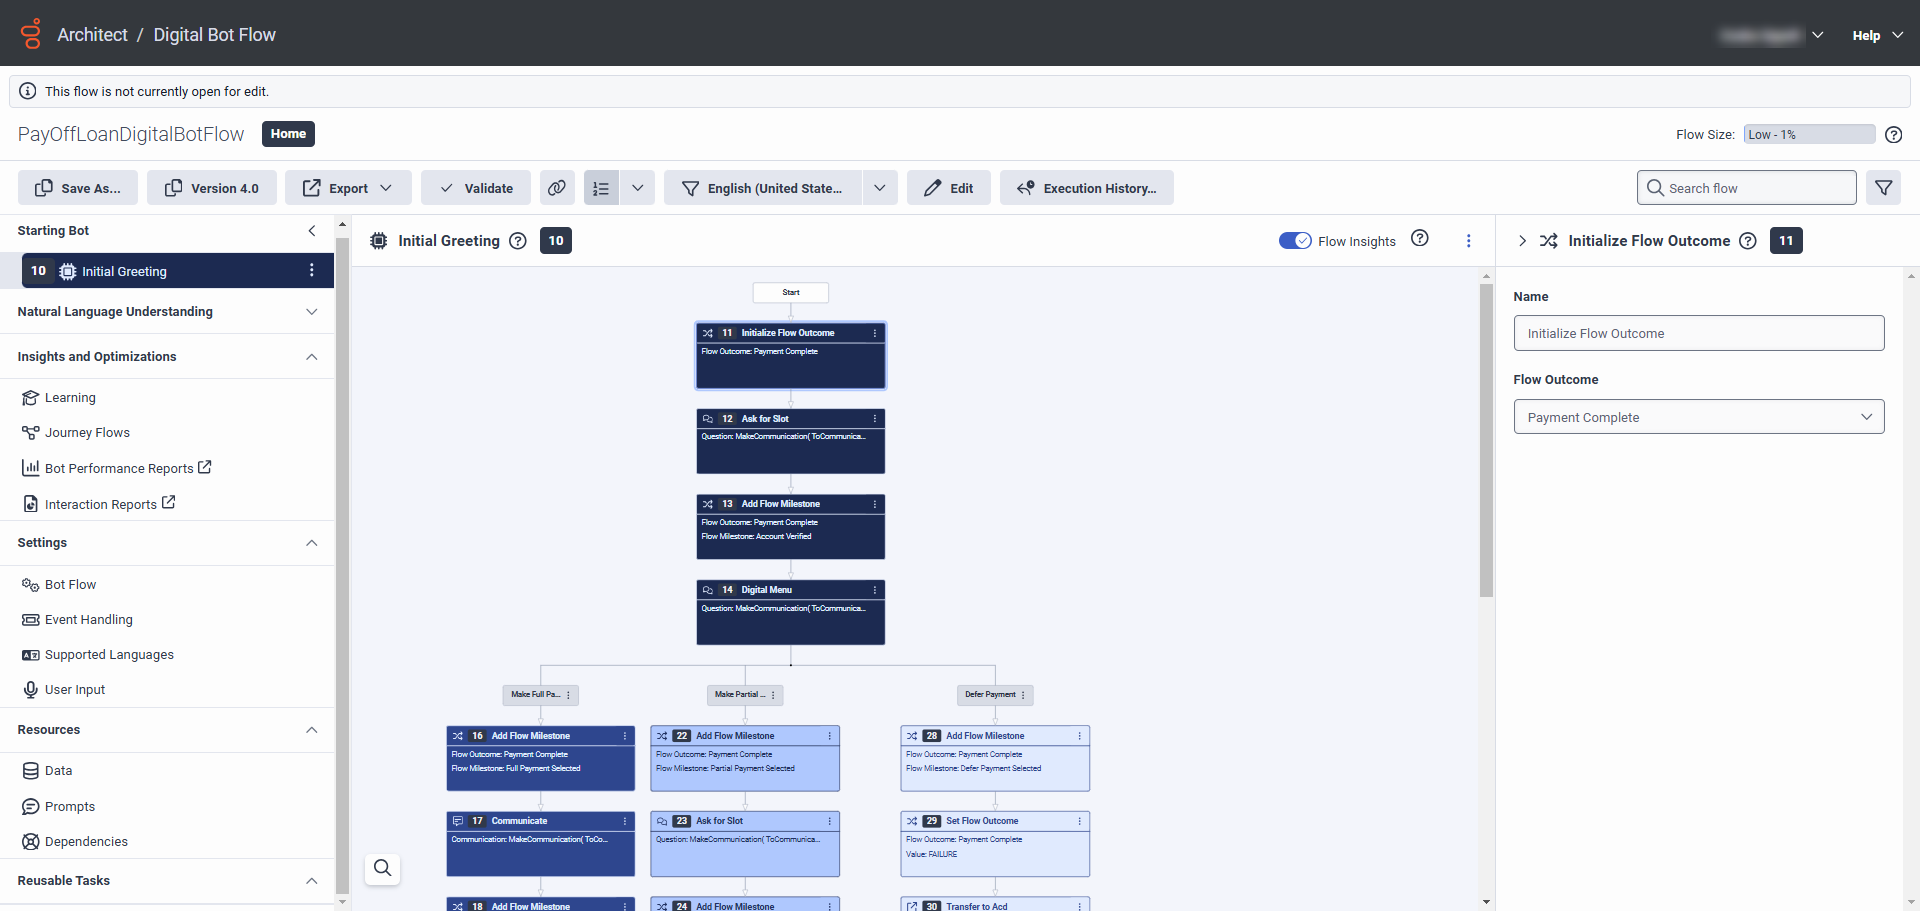
- Utilice el conmutador Flow Insights para mostrar el mapa de calor de interacción del flujo. Nota: Debe haber datos de interacción de los últimos siete días para que aparezca el mapa de calor.
- Busque componentes de flujo con niveles de frecuencia (recuento de interacciones) elevados y compruebe si los clientes disminuyen en los pasos posteriores. En el siguiente ejemplo, los clientes llegan a la acción Digital Menu en un flujo de bots digitales, pero no consiguen avanzar más:
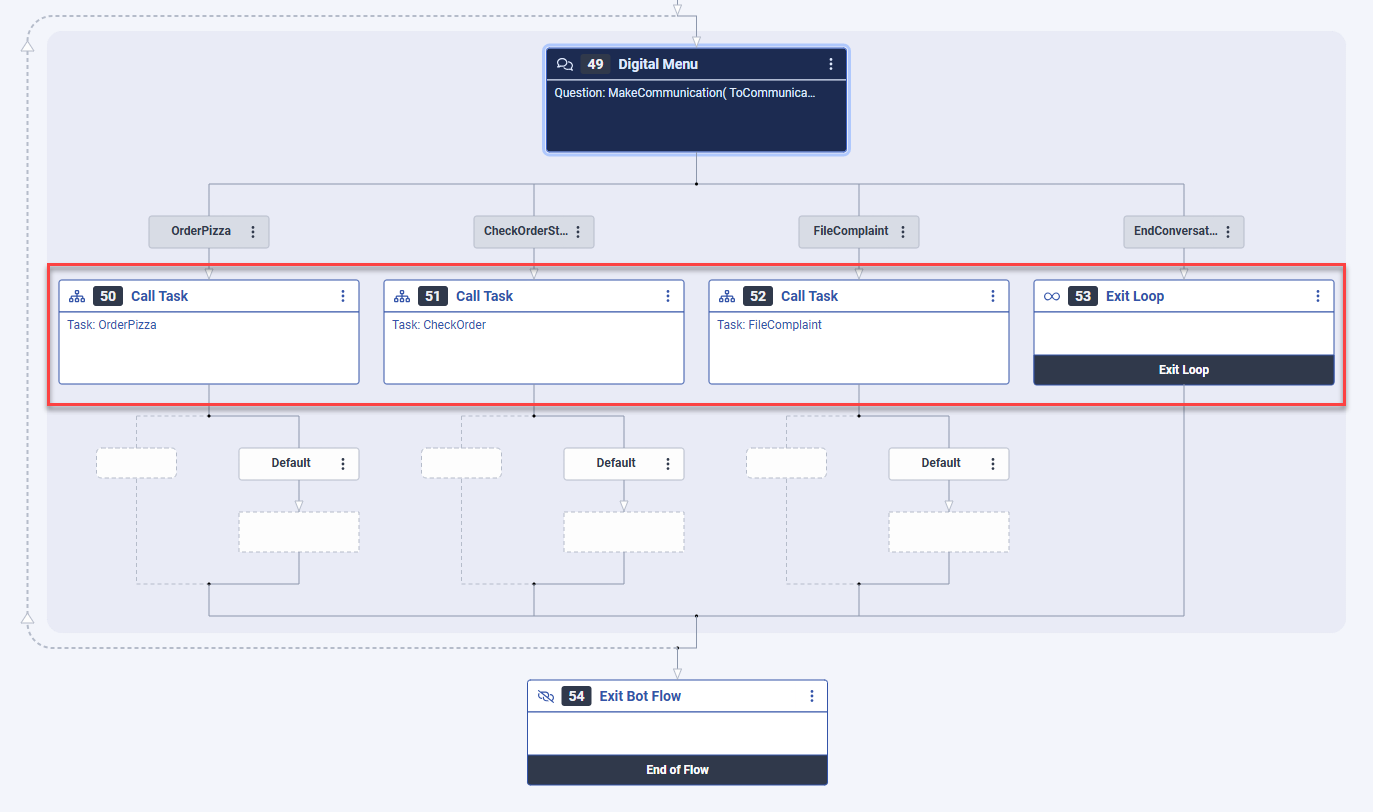
- Ahora, examine la acción del Menú Digital para revisar y determinar por qué se está estancando el progreso e identifique las acciones necesarias para eliminar los puntos de fricción.
Obtenga información detallada sobre el recorrido de sus clientes con Journey Flows:
Principales ventajas
Casos clave detallados
Información práctica
Supongamos que eres un administrador o analista de un contact center que quiere evaluar la eficacia de un bot. Su objetivo es comparar el número de clientes que logran una resolución a través del bot frente a un agente humano (ACD). Para llevar a cabo esta tarea, utilice las funcionalidades de Journey Flows.
- En la página de inicio de Architect, haga clic o pase el ratón por encima del menú Flows y seleccione el tipo de flujo deseado.
- Haga clic en el flujo que desea analizar.
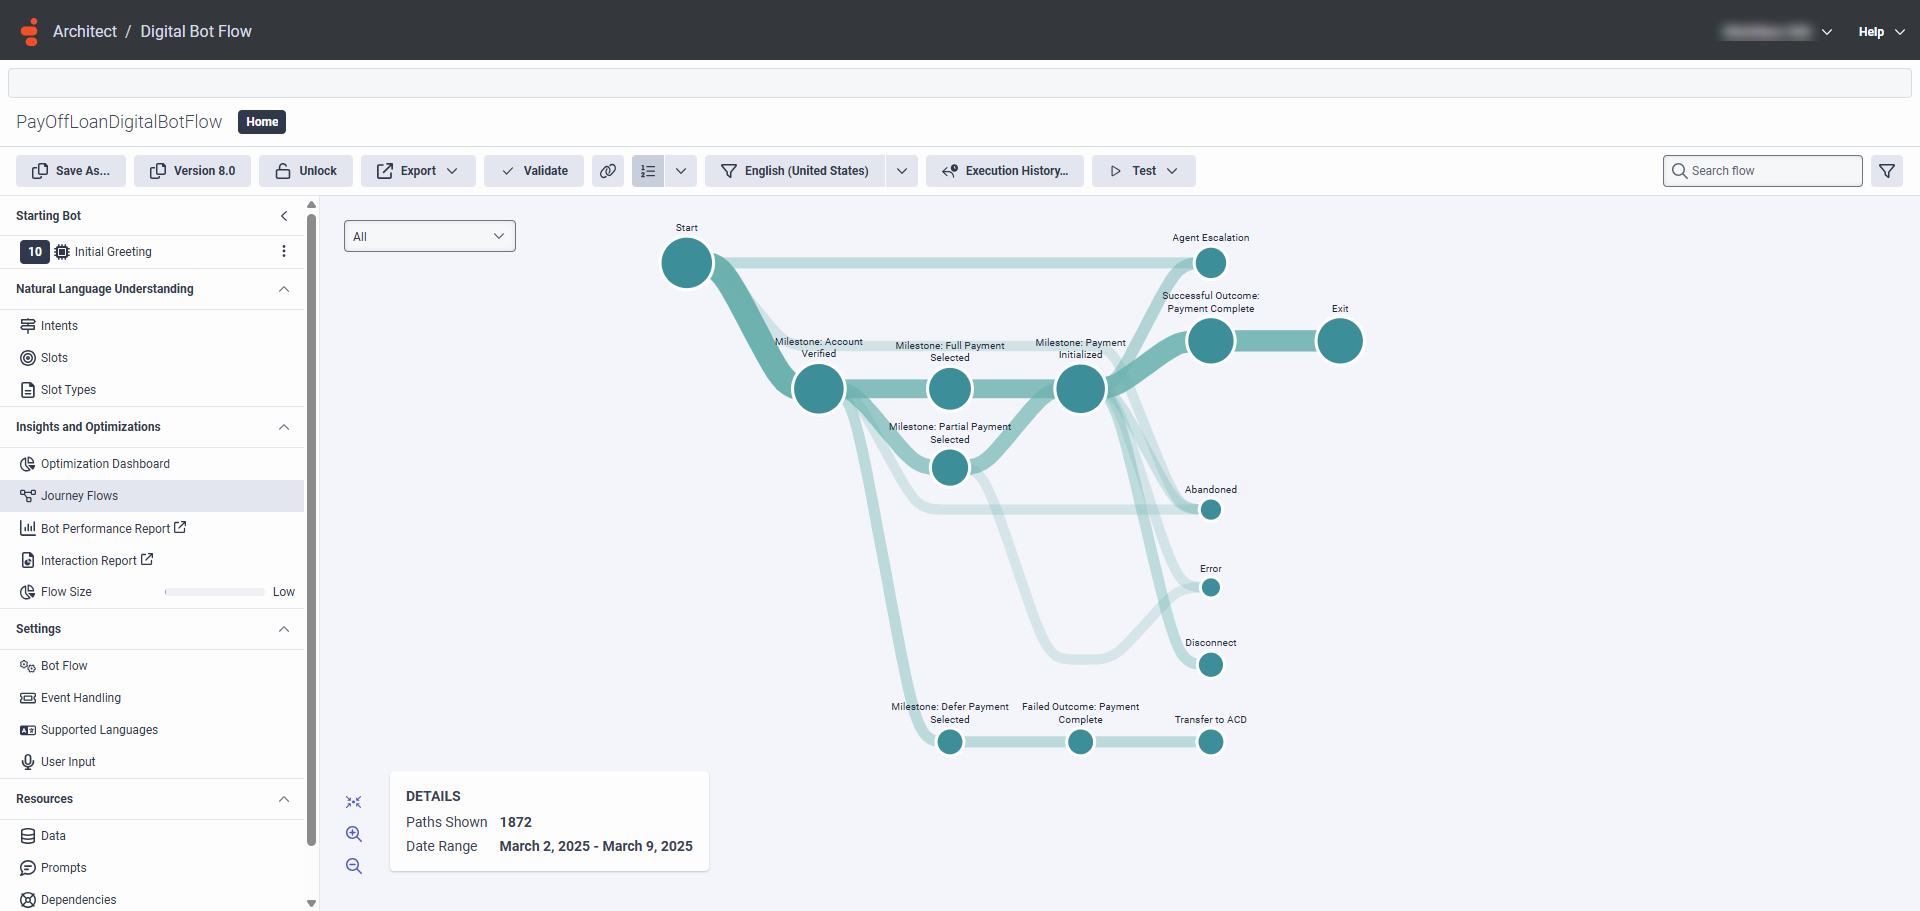
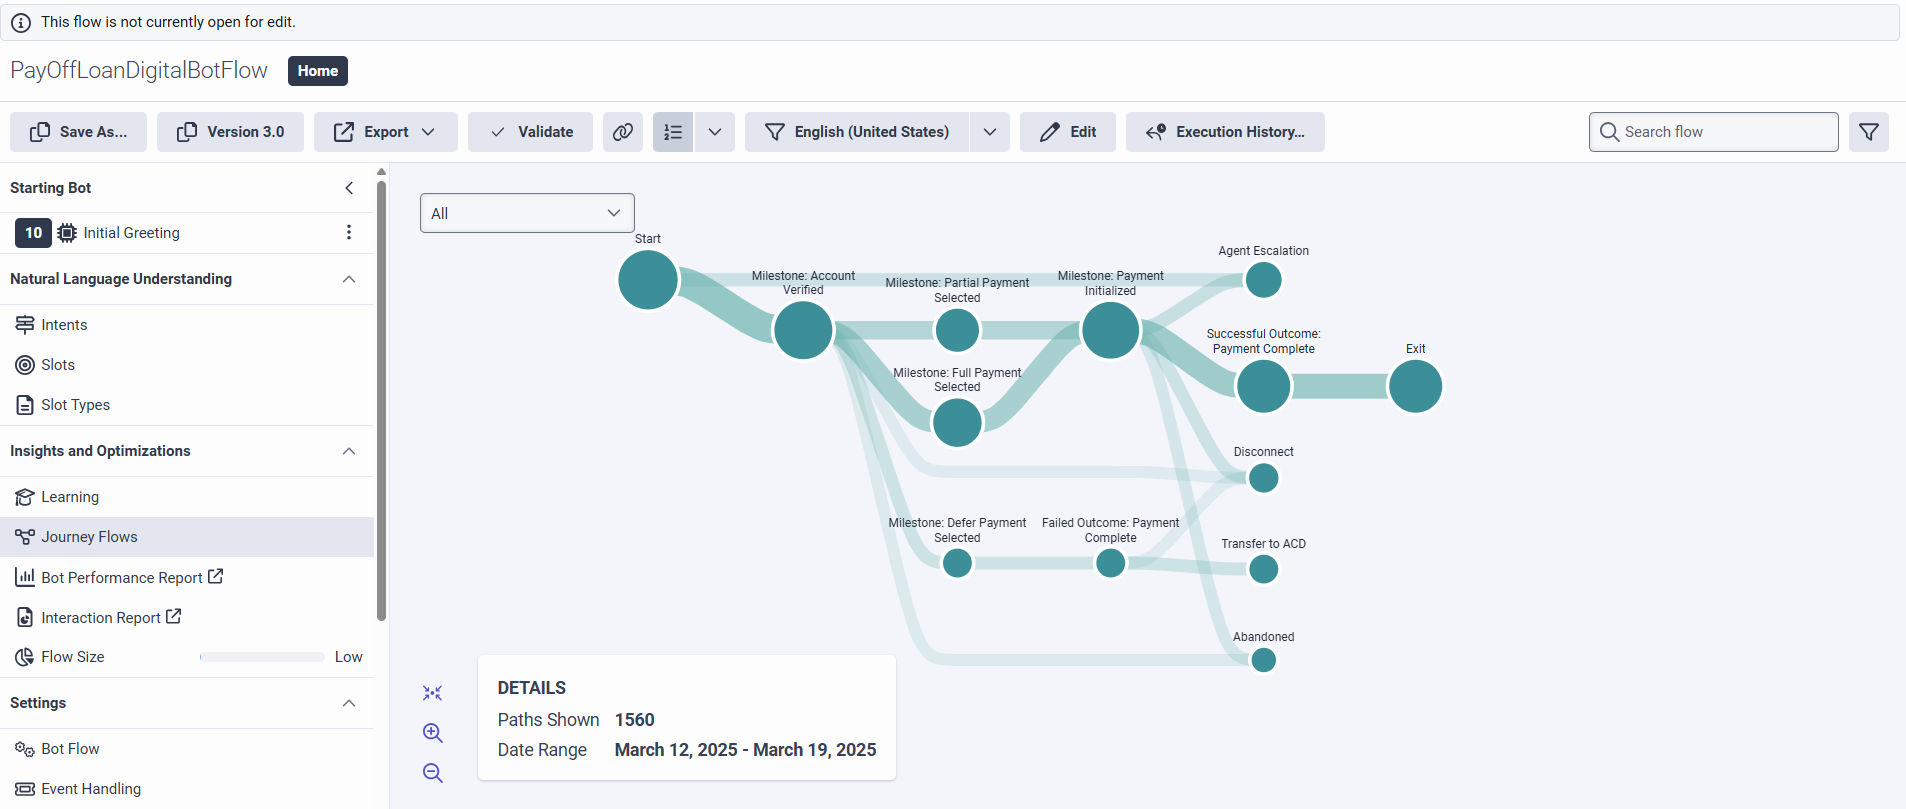
- Haga clic en Journey Flows en el menú Insights and Optimizations. Se abre la visualización Flujos de viaje. La visualización muestra la distribución de los clientes a lo largo de los distintos hitos y resultados del flujo, así como los distintos motivos de salida del flujo. La visualización también muestra cómo progresa el recorrido del cliente en cada etapa del flujo:
- A continuación, como desea saber cuántos clientes fueron al hito Payment Initialized , pase el ratón por encima del hito para mostrar el recuento de frecuencias:
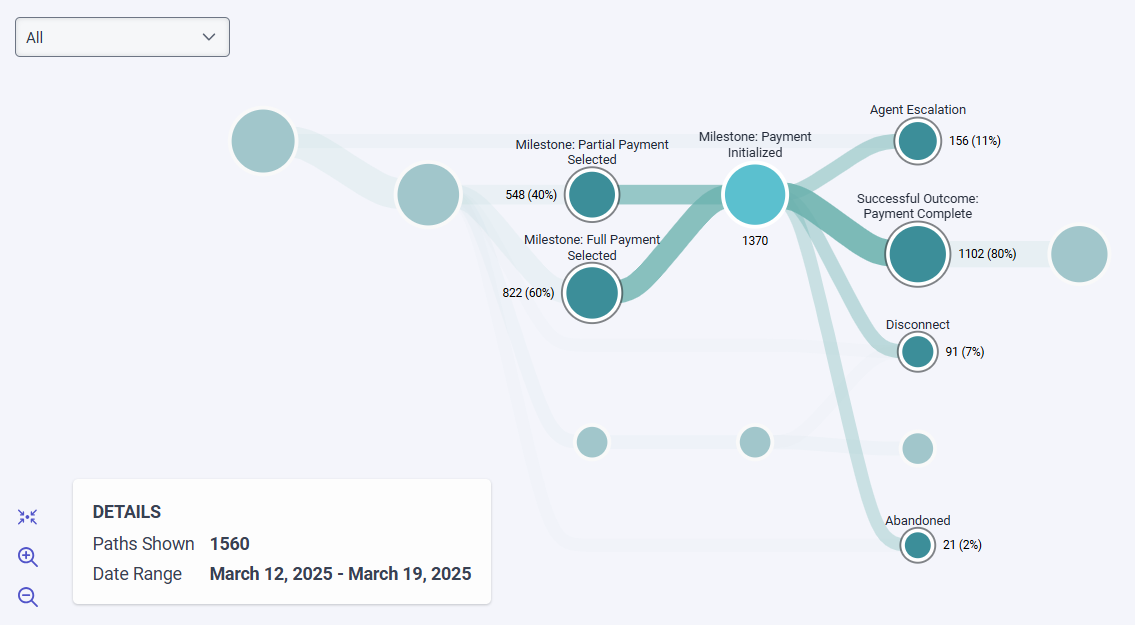
- Ahora, para examinar por qué el 11% de los clientes que completaron el hito Pago Inicializado pidieron hablar con un agente humano y el 7% de los clientes desconectaron la llamada, utilice Flow Insights para generar un mapa de calor de las opciones del Menú Digital en su menú de Configuración Inicial o utilice Replay Mode para comprobar las instancias de ejecución de su flujo.
- A continuación, examine las sesiones que fueron Abandonadas.
Obtenga información detallada sobre la experiencia de sus clientes con Replay Mode:
Principales ventajas
Casos clave detallados
Información práctica
- En la página de inicio de Architect, haga clic o pase el ratón por encima del menú Flows y seleccione un tipo de flujo para el que estén disponibles datos de ejecución históricos.
- Abra el flujo que ejecutó previamente para depurar y solucionar problemas.
- Haga clic en Historial de ejecución. Se abre el cuadro de diálogo Historial de ejecución de flujos.
- En Resultados, Architect enumera las instancias de ejecución anteriores del flujo que ha abierto y proporciona el nombre, la versión y el tipo de flujo, así como la fecha y hora de inicio y fin de las instancias de flujo.
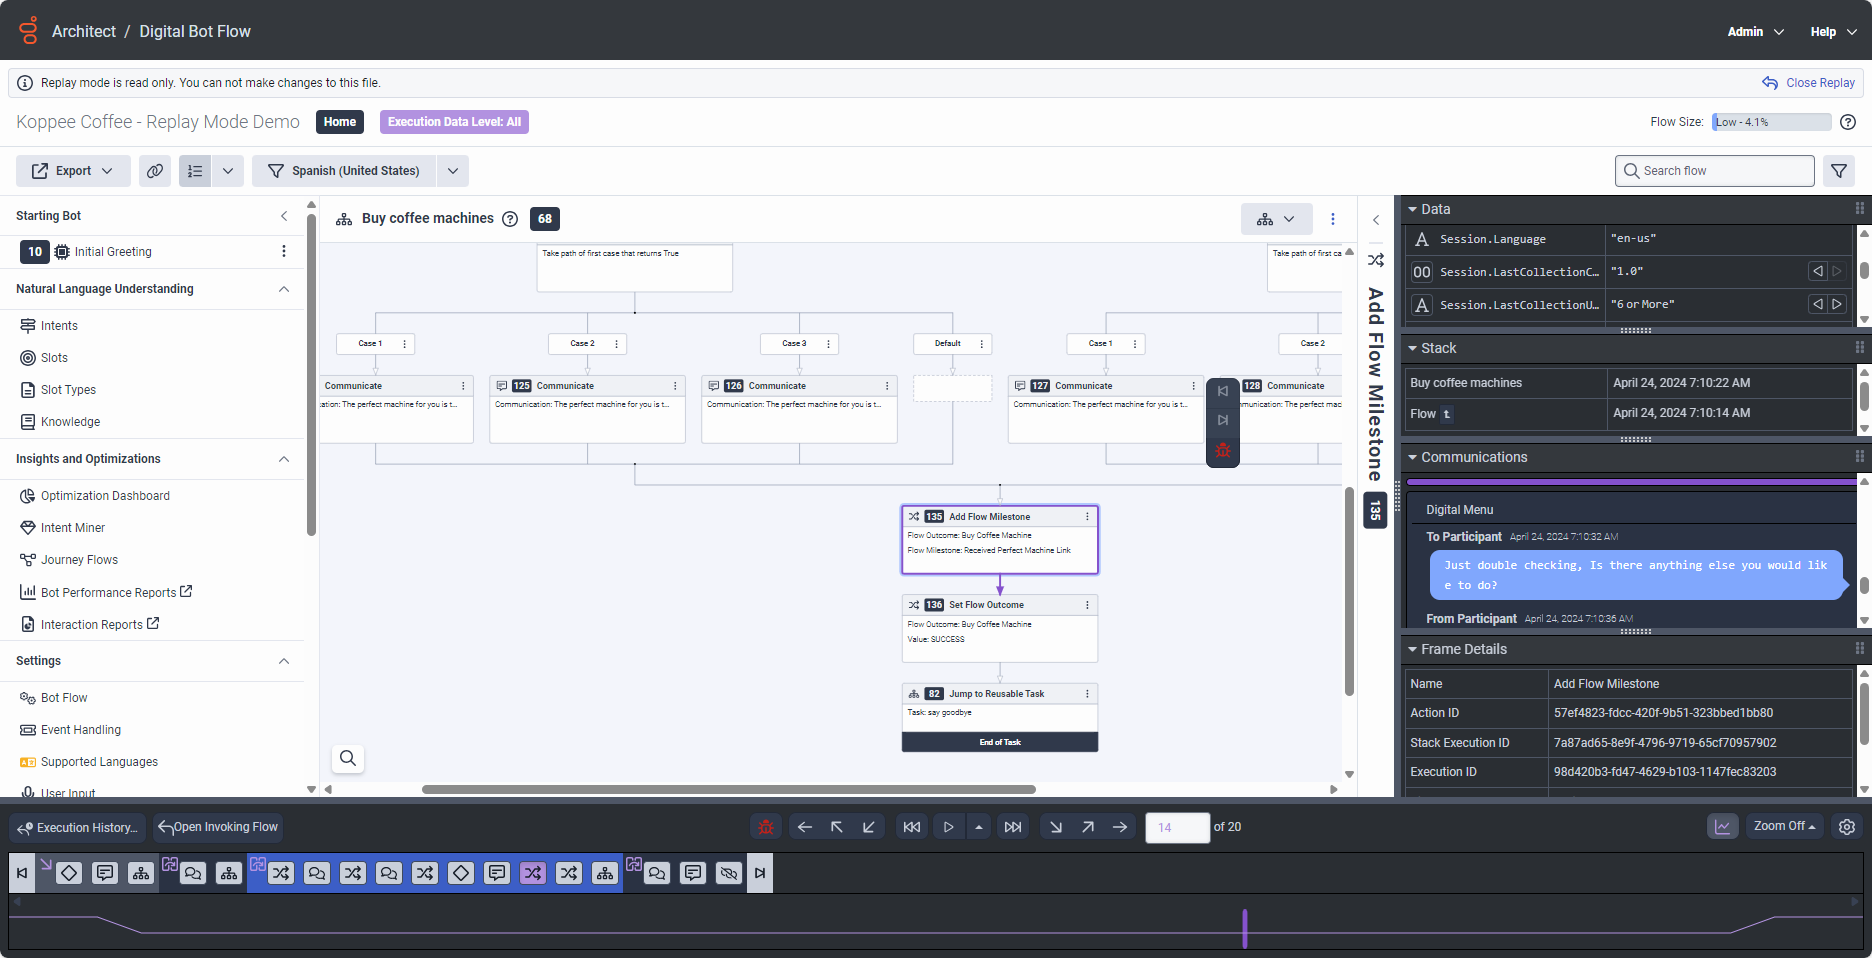
- Haga clic en una instancia de flujo para abrirla en el modo de reproducción. Para obtener más información, consulte Utilizar el modo de repetición para solucionar problemas de un flujo de Architect.
- Utilice los controles de reproducción para recorrer el flujo y reproducir la secuencia de acciones que conducen al componente específico del flujo que desea analizar.
- Si el nivel requerido de datos de ejecución está disponible, revise los intercambios de comunicación e inspeccione también los valores de las variables para localizar el problema con el componente de flujo.
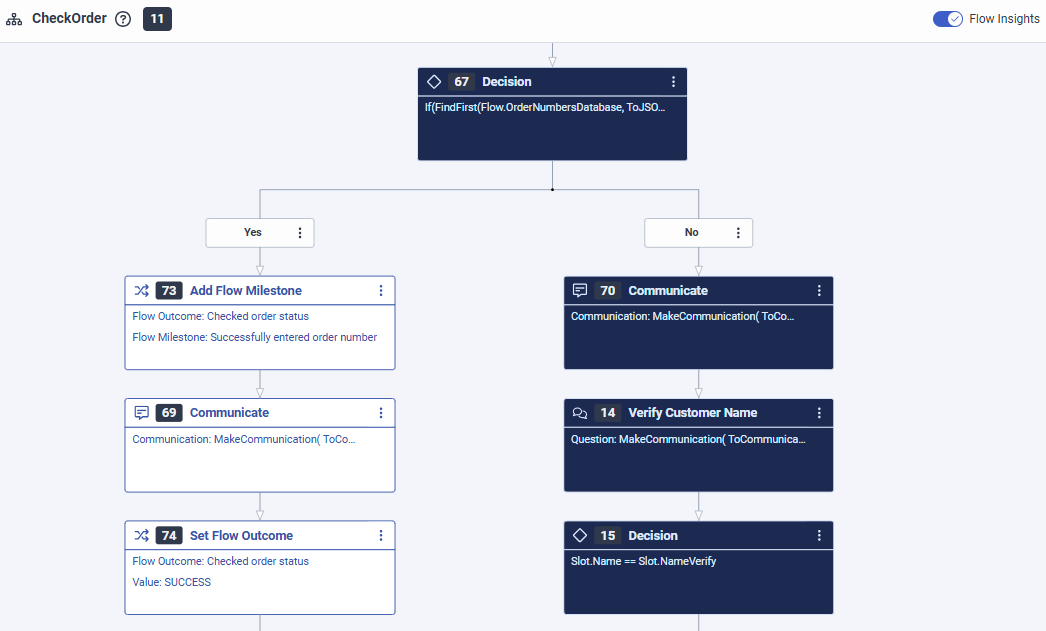
En el siguiente ejemplo de flujo de bot digital, los clientes introducen su número de pedido para comprobar el estado del mismo, pero el bot no reconoce el número.
- El diseñador del flujo utilizó una acción Ask for Slot para verificar el número de pedido y utilizó una ranura del tipo
builtin:anypara almacenar la entrada del cliente. - Después de que el bot recibe la entrada, el flujo pasa a una acción de decisión que utiliza la expresión
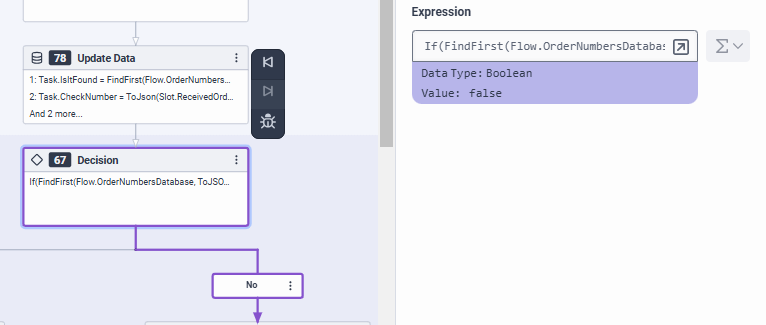
If(FindFirst(Flow.OrderNumbersDatabase, ToJSON(Task.CheckNumber))==-1, false, true)para determinar si la matriz de números de pedido existentes almacenada en la variableFlow.OrderNumbersDatabasecontiene el número de pedido que introdujo el cliente (Task.CheckThisNumber).
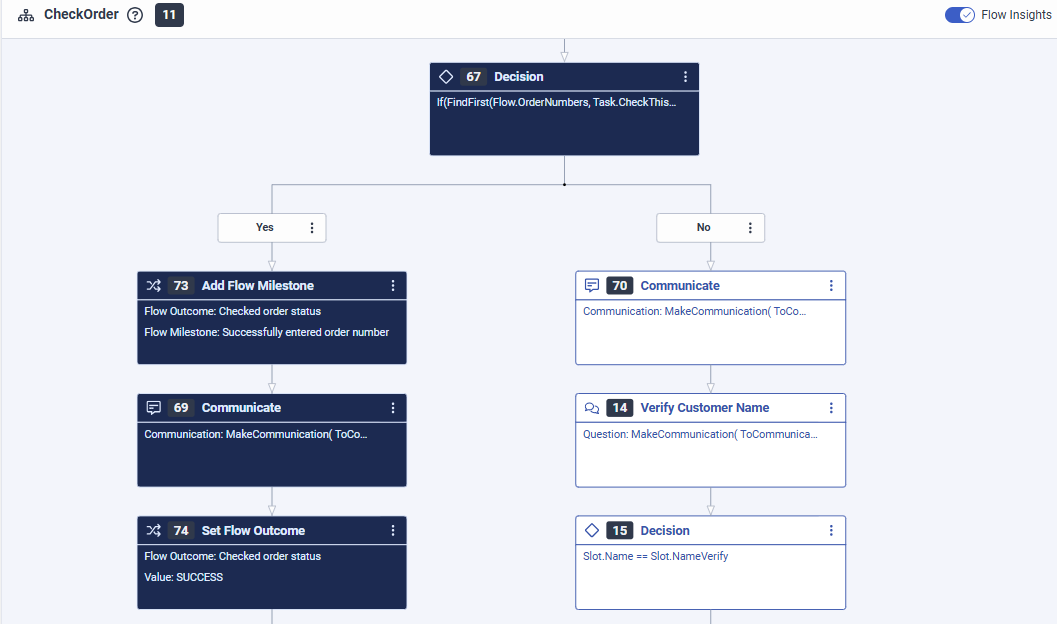
El análisis del mapa de calor de Flow Insight muestra que la acción Decision siempre toma el camino infeliz:
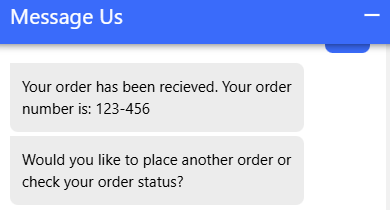
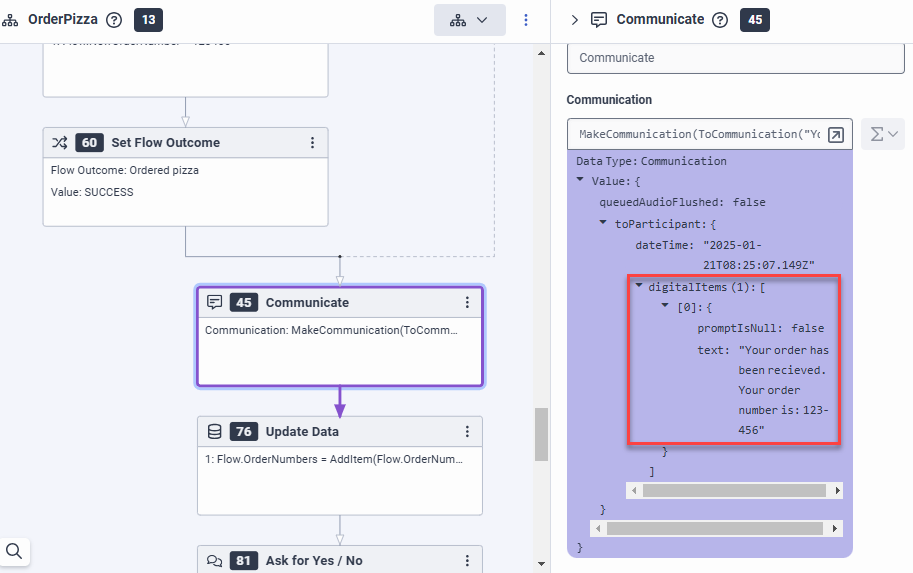
El modo Repetición de Architect proporciona la clave para entender por qué ocurre esto. El bot utiliza un patrón con el formato ###-### para mostrar el número de pedido de los clientes, donde cada # representa un dígito (0-9) y - es un separador de guiones. El formato agrupado es un patrón familiar para los clientes que reduce la probabilidad de errores en comparación con una larga cadena de dígitos, y facilita la lectura y el recuerdo del número.
El problema de reconocimiento se produce porque el bot proporciona el número de pedido en el formato###-###, pero el bot espera una cadena de dígitos sin guiones como entrada del usuario (véanse los números de pedido en la variable Flow.OrderNumbersDatabase ). Este desajuste en el diseño del flujo provoca fallos de reconocimiento.
El modo de repetición reveló que el bot debe manejar los guiones en la entrada del cliente. Para solucionar el problema de reconocimiento, utilice un tipo de ranura regex con el patrón ^\d{6}$|^\d{3}-\d{3}$ para validar el formato de entrada y eliminar los guiones antes de comprobar el número de pedido en la base de datos de pedidos.
Obtenga información detallada sobre los recorridos de sus clientes con Journey Management:
Principales ventajas
Casos clave detallados
Información práctica
Supongamos que usted es un analista de centros de contacto que evalúa la eficacia de los bots diseñados para aplicaciones de medios sociales. Su objetivo es comparar el número de clientes que logran resolución a través de bots frente a agentes humanos (ACD). Para ello, utilice las funciones de Journey Analyzer.
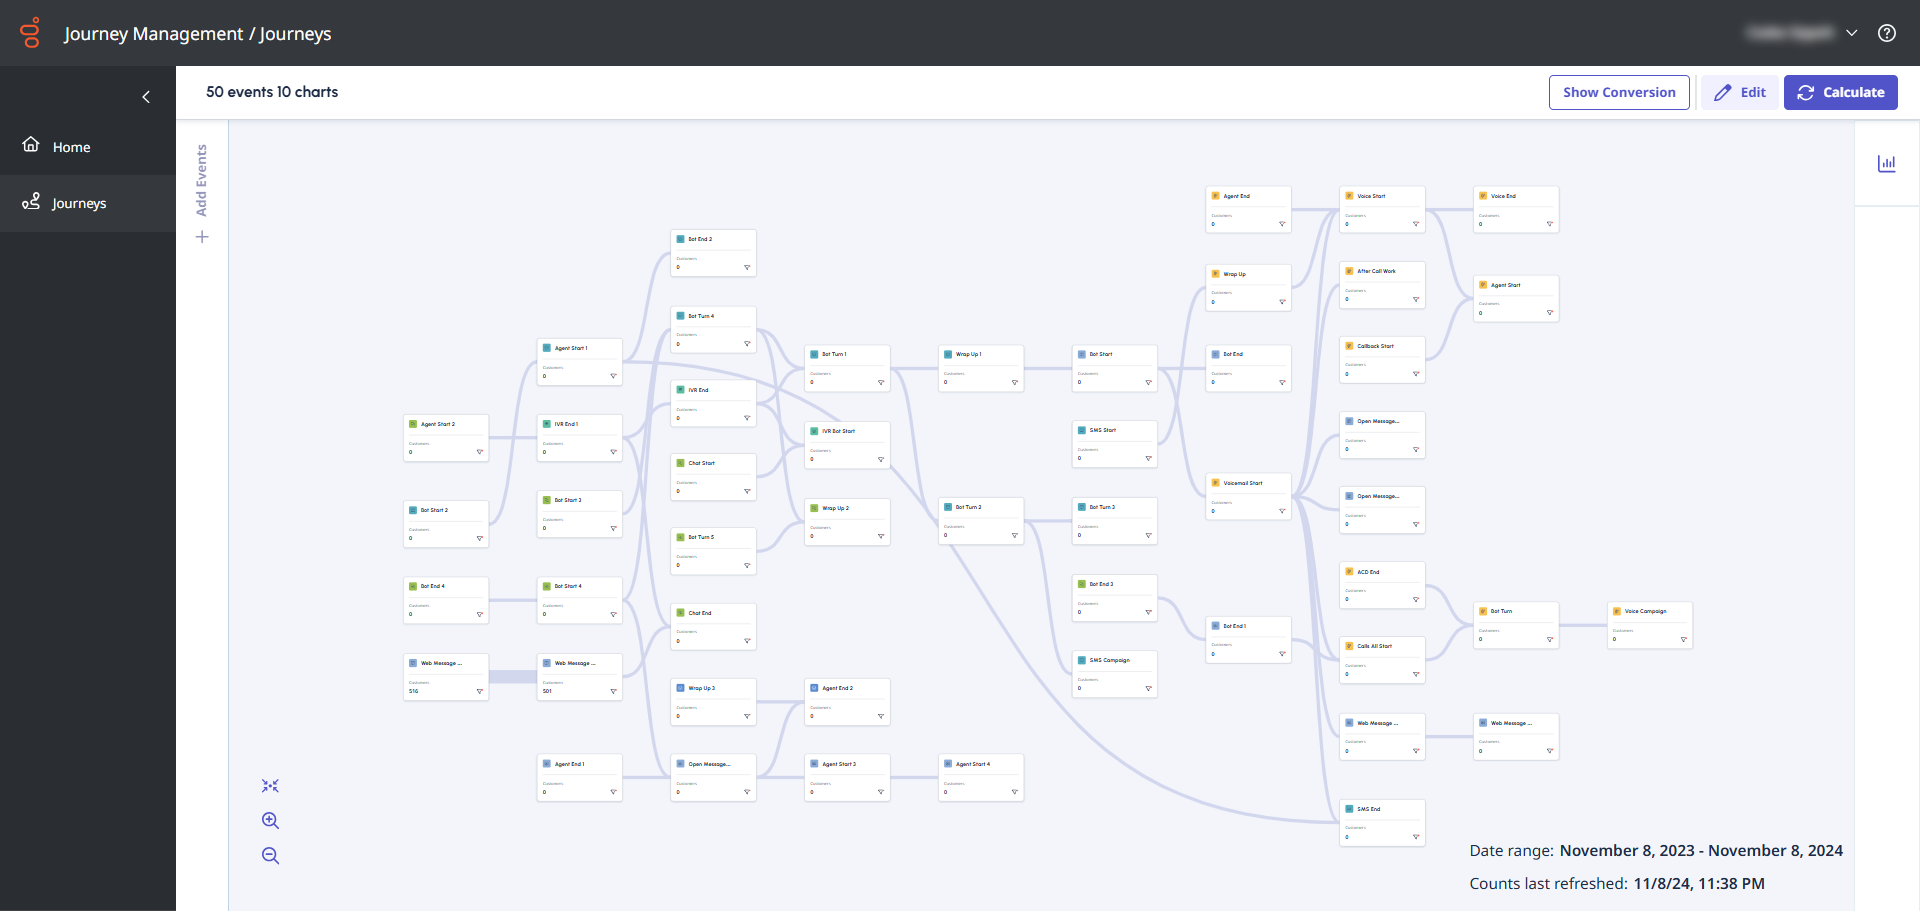
- Inicie sesión en su cuenta de Genesys Cloud y haga clic en el menú Journey Management . Se abre la pantalla Gestión de viajes .
- Crear un nuevo viaje.
- Para entrar en el modo Editar y modificar un trayecto, haga clic en Editar.
- Los eventos de viaje se ajustan a los tipos de acciones de que se desencadenan a lo largo de una interacción. El eventoe Customer Start se activa cuando un cliente entra en contacto con un canal. Arrastre un evento de Inicio de cliente y fíltrelo para el canal social que desea medir.
- Abra el evento, haga clic en el icono de filtro y seleccione lo siguiente:
- MediaType - Mensaje
- MessageType - Los canales sociales que desea medir
- Añade un nombre descriptivo en el lienzo a este evento como, por ejemplo, Inició un engagement socialnt en Twitter.
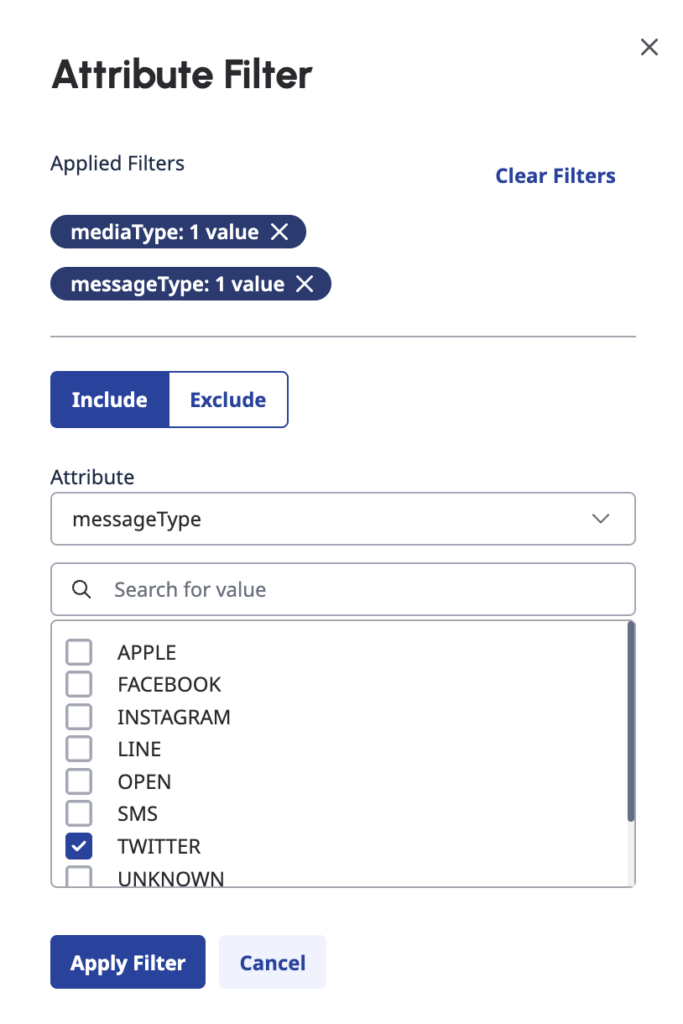
- A continuación, como desea saber cuántos clientes fueron a Bot Start después de que iniciaran su compromiso social, arrastre y suelte Bot Start al lienzo y, a continuación, deje que se conecte a Customer Start.Consejo: Utilice la tecla Tab del teclado para desplazarse por la lista de eventos y utilizar el menú.
- Para limitar el evento al nombre del bot, incluya el nombre del bot como un filtro de atributo de evento .
Consejo: Puedes encontrar el nombre del bot en Architect. Journey Management admite eventos bot nativos o de terceros, pero los bots nativos proporcionan datos más detallados del trayecto.
- Para limitar el evento al nombre del bot, incluya el nombre del bot como un filtro de atributo de evento .
- Ahora, para examinar las sesiones de bot completadas, arrastre Bot End al lienzo y, a continuación, deje que se conecte a Bot Start.
- Dado que está interesado en el mismo bot que examinó en el paso 6, incluya el identificador del bot como un filtro de atributo de evento en este evento.
Consejo: Si utiliza un bot nativo de Genesys, para limitar su análisis a una intención y otros atributos de interacción que puedan ser relevantes, añada Bot Turn entre el inicio y el final. - Para ver las sesiones de bot completadas, incluya el filtro botsessionOutcome y, a continuación, seleccione el atributo complete.
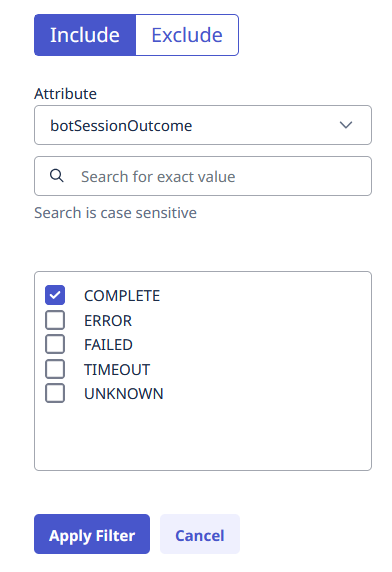
- Haga clic en Aplicar filtro.
- Como en este evento se examinan las sesiones bot completadas y no las sesiones que pasaron a ACD (distribución automática de llamadas), añada un filtro BotResult en la sección Exclude con TransfertoACD como valor.
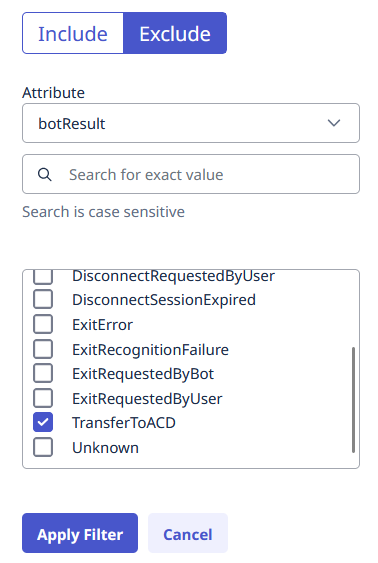
- Haga clic en Aplicar filtro.
- Dado que está interesado en el mismo bot que examinó en el paso 6, incluya el identificador del bot como un filtro de atributo de evento en este evento.
- A continuación, examine las sesiones que pasaron a ACD. Arrastre tel evento ACD Start al lienzo. Que se conecte a Bot Start, de modo que sea paralelo a Bot End.
- En este evento, seleccione queueID como Atributo, y luego añada un filtro para la Cola de pago.
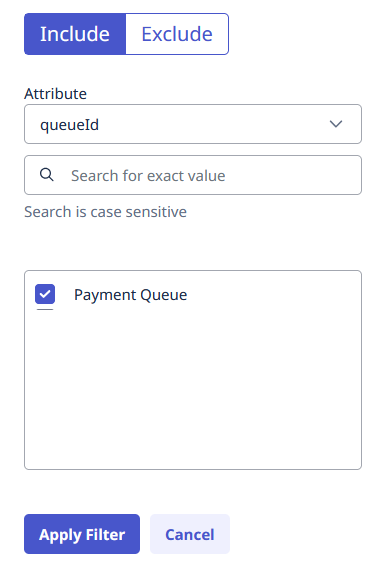
- Hacer clic Ahorrar.
Calcular y editar el recorrido de la muestra
- Haga clic en Calcular para generar trayectos. Aparece una notificación sobre el recuento de cálculos.
- Para continuar, pulse Proceda. El cálculo tarda unos minutos en ejecutarse. El tiempo de carga depende del volumen de datos a procesar, por lo que los conjuntos de datos más grandes tardan más en calcularse. Para ver los resultados, actualice la página.
- Una vez finalizado el cálculo, desea conocer el número de llamadas resueltas por los agentes. Para editar el viaje, haga clic en Editar.
- Arrastre el evento Agent Start, y deje que se conecte al evento ACD Start.
- Añada un filtro para la cola de pagos . La cola de pagos tiene dos códigos de liquidación: Éxito y Fracaso.
- Realice un seguimiento de la resolución del agente con un código de resumen de éxito. Desde el grupo de eventos Voice, arrastre un evento Wrap Up al lienzo y deje que se conecte con el evento Agent Start . Seleccione el atributo wrapupCode e incluya el identificador del código de envoltura Success como filtro.
Nota: Yuede obtener la lista de ID de código de envoltura utilizados en su entorno con el punto final de la API de envoltura a través de API Explorer, que está disponible en el sitio de desarrolladores de Genesys Cloud. - Para indicar que se trata del código de resumen Success, añada un título descriptivo a su evento posterior a la llamada, como "Resolución satisfactoria".
- Realice un seguimiento de la resolución del agente con un código de resumen de éxito. Desde el grupo de eventos Voice, arrastre un evento Wrap Up al lienzo y deje que se conecte con el evento Agent Start . Seleccione el atributo wrapupCode e incluya el identificador del código de envoltura Success como filtro.
- Añada un filtro para la cola de pagos . La cola de pagos tiene dos códigos de liquidación: Éxito y Fracaso.
- Hacer clic Ahorrar.
- Para actualizar el trayecto, pulse Calcular. Para ver los recuentos actualizados, actualice la página.
Ver el análisis del embudo en el viaje de muestra
Con la ayuda del análisis del embudo , puede comprender cómo se mueven sus clientes a lo largo del trayecto hasta alcanzar sus objetivos y, a continuación, determinar las tasas de éxito de cada una de sus trayectorias.
Un trayecto debe tener cálculos para el análisis del embudo.
- Abra el trayecto existente que desea analizar.
- En el modo de edición , haga clic en Mostrar conversión. Journey Analyzer calcula las métricas de conversión.
- Para examinar las métricas atribuidas, vuelva a hacer clic en el icono + en la esquina superior derecha del evento. Para ocultar las métricas de conversión de un evento, haga clic en el icono - de la esquina superior derecha.
- Para determinar el recorrido que siguieron sus clientes, examine las métricas Clientes, Tasa de conversión, Abandonaron fuera y Avanzaron en los respectivos eventos.
Ejemplo: El análisis del embudo en el evento Bot Start muestra que 650 clientes abandonaron el viaje en este punto, y 1052 clientes Avanzaron hasta Bot end, por lo que Bot end tiene una tasa de conversión del 61,7%. Esto significa que el 61,7% de sus clientes procedió a llegar a la Bot final sesión.
- Cambie siempre el nombre de los eventos para que el recorrido sea legible para los nuevos usuarios y para que coincida con el escenario.
- Journey Management le permite comprobar sus propias hipótesis sobre los recorridos de los usuarios. Por ejemplo:
- Puede modelar un escenario para probar que si los clientes pasan por el Bot A, ¿se escalan a un ritmo mayor que los clientes que pasan por el Bot B? Puede arrastrar varios eventos Bot Start a su viaje, y establecer filtros de atributos para Bot A y Bot B, respectivamente.
- Puede examinar el impacto del lenguaje. Por ejemplo, medir si los clientes que interactúan con un bot angloparlante completan las interacciones con el mismo éxito que los clientes que interactúan con un bot francófono. En este análisis, puede utilizar el filtro de idioma en el evento Bot Start.
- Puede trabajar con Journey Flows para ver patrones dentro de los flujos y ver si hay problemas que desee explorar. Por ejemplo, si observa escaladas, utilice Journey Analyzer para comprender la naturaleza de la escalada, la frecuencia y el resultado.
Nota: La gestión de viajes y los flujos de viajes son dos potentes herramientas que pueden complementarse, pero presentan varias diferencias. Para más información, consulte Diferencias entre la gestión de viajes y los flujos de viajes. - Las vistas de rendimiento también pueden ayudarle en sus análisis, como Resultados de flujo en Architect, la vista de rendimiento de colas , o la vista de interacciones en Workspace.
- La página AppFoundry ofrece varias plantillas que puede utilizar para empezar.

