Navegar por la página principal de previsiones
- Genesys Cloud CX 3, Genesys Cloud CX 4, Genesys Cloud CX 3 Digital, Genesys Cloud CX 1 WEM Add-on II, Genesys Cloud CX 2 WEM Add-on I, o licencia Genesys Cloud EX
- Los siguientes permisos:
- Gestión del personal > mainForecast > Todos
- Workforce Management > mainForecast > View
- Gestión del personal > Grupo de planificación > Ver
- Analítica > conversaciones agregadas > Vista
- Enrutamiento > Cola > Vista
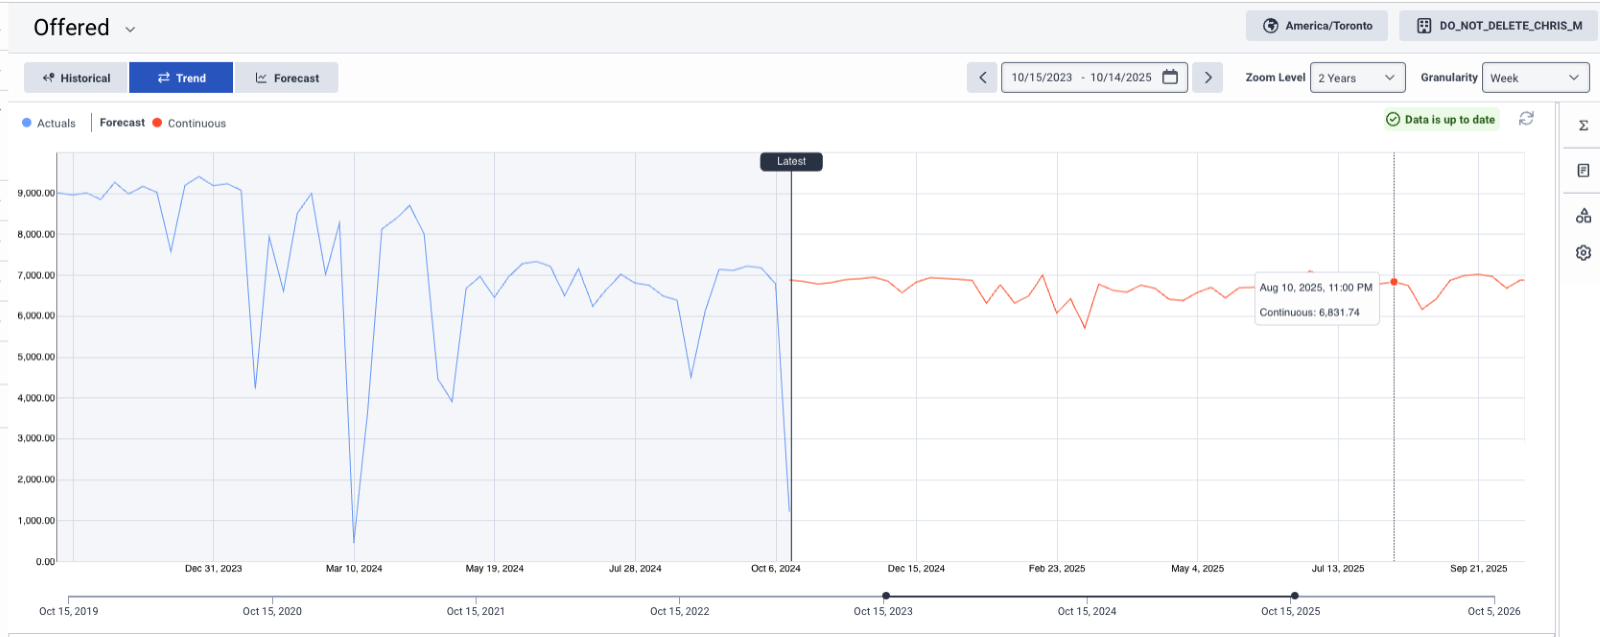
La vista de previsión principal muestra datos reales y previstos agregados interacción . Forecasts contain 2 years (104 weeks) of data and actuals contain for up to 5 years (261 weeks) of data. El data incluye ofrecido y tiempo medio de manipulación. Los datos se organizan por grupos de planificación y pueden filtrarse por métrica, fechas, y grupos de planificación.
La vista principal de previsiones tiene las siguientes secciones:
Haga clic en la imagen para ampliarla.
| Opción | Descripción | ||||||||||||
|---|---|---|---|---|---|---|---|---|---|---|---|---|---|
| Selector principal de métricas de previsión |
La vista de previsión principal muestra una métrica cada vez. Utilice la lista desplegable del selector de métricas disponible en la esquina superior izquierda de la página Previsión principal para cambiar entre la métrica Oferta y Tiempo medio de gestión. La métrica Ofrecida se muestra por defecto. |
||||||||||||
| Selector de zona horaria |
Seleccione una zona horaria en la lista desplegable de la esquina superior derecha. Este campo muestra por defecto la previsión en la zona horaria de la Unidad de Negocio. |
||||||||||||
| Selector de unidad de negocio |
Acceda a los datos de una unidad de negocio concreta seleccionándola en el selector de unidades de negocio situado en la esquina superior derecha. |
||||||||||||
| Principales vistas de Previsión |
Las principales vistas de previsión incluyen:
|
||||||||||||
| Selector de intervalo de fechas |
Filtre los datos de a un intervalo de fechas específico de . Además, al pasar el ratón por encima, se visualiza la zona horaria de la unidad de negocio y se muestran los detalles de la zona horaria. |
||||||||||||
| Selector de nivel de zoom |
Controle el rango de los datos que desea visualizar en el gráfico . Puede utilizar los distintos niveles de zoom preconfigurados para navegar rápidamente por el gráfico . Tel nivel de zoom afecta a la granularidad mostrada en el gráfico de previsiones y cuando el nivel de zoom no coincide con las opciones predefinidas, aparece en blanco. También puede ampliar y reducir el gráfico utilizando la rueda de desplazamiento del ratón Ctrl y (Windows) y command + (Mac). |
||||||||||||
| Selector de granularidad |
Control la granularidad de los datos que desea visualizar. La siguiente tabla ilustra las granularidades soportadas por por nivel de zoom:
La página principal Previsión admite:
|
Haga clic en la imagen para ampliarla.
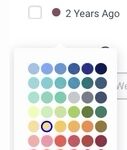
Esta sección de permite seleccionar hasta dos conjuntos de datos adicionales de las dos categorías siguientes:
Haga clic en la imagen para ampliarla.
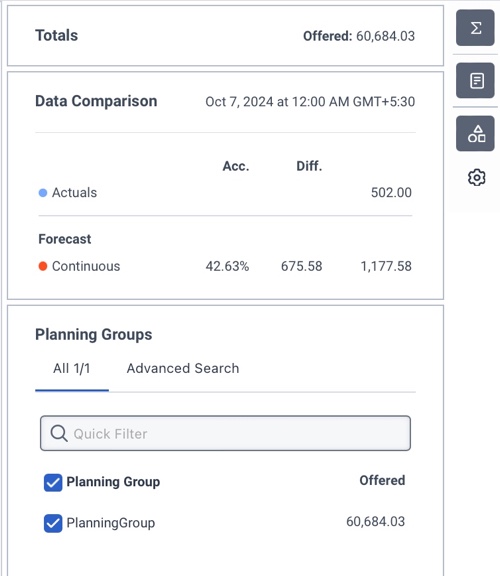
La parte derecha de la vista de previsión principal muestra varios widgets que proporcionan información adicional y opciones.
| Widget | Descripción |
|---|---|
| Widget de totales |
Ver los totales previstos para la métrica seleccionada en función del intervalo de fechas seleccionado. |
| Widget de comparación de datos |
Visualice los valores del gráfico pasando el ratón por encima. Vea detalles como la previsión continua, los datos reales y cualquier conjunto de datos adicional seleccionado. El widget muestra los datos correspondientes al punto de datos por defecto. El punto de datos por defecto es Último o la mitad del gráfico, si Último no es visible según el intervalo de fechas seleccionado. Si tanto las previsiones como los datos reales están disponibles para el punto de datos especificado, el widget de comparación incluye datos de análisis comparativo, como la diferencia y la precisión. |
| Widget del Grupo de Planificación |
Seleccione grupos de planificación para filtrar los datos. Utilice el filtro rápido para encontrar grupos de planificación en función de su nombre. Utilice la opción de búsqueda avanzada para encontrar grupos de planificación en función del tipo de medio, la cola, el idioma y las competencias. Nota: La administración de la fuerza laboral admite voz entrante, chat, devoluciones de llamada, mensajes y tipos de medios de correo electrónico para la previsión y la programación. Las devoluciones de llamada programadas, las devoluciones de llamada no programadas y los tipos de medios de correo de voz ACD aparecen como devoluciones de llamada en los pronósticos y programas.
|
| Widget Opciones de visualización |
Restablezca la vista Pronóstico principal a los valores predeterminados mediante las siguientes opciones:
|


